Posts in BLOG

From IoT Prototype to Production: 10 Practical Steps to Deploy Your Project in the Real World

August 21st, 2026 Posted by BLOG, HOW-TO, Internet of Things, IOT PLATFORM, PARTNER 0 thoughts on “From IoT Prototype to Production: 10 Practical Steps to Deploy Your Project in the Real World”

Getting an IoT prototype to work feels like a major victory.

The sensor is collecting data. The microcontroller is connected. MQTT messages are flowing. The dashboard is displaying beautiful graphs. Perhaps an alert appears when a reading crosses a threshold. You demonstrate it to your lecturer, manager, customer, or potential partner, and everyone around the table seems happy.

Then someone asks the question that changes the entire conversation:

“Can we deploy this at our actual site?”

Suddenly, the prototype that looked complete feels like only the beginning.

I have seen this happen many times. A prototype proves that an idea is technically possible, but putting that same system into daily operation introduces a completely different set of challenges. Instead of one device sitting comfortably on a laboratory table, you may have dozens or hundreds of devices scattered across buildings, factories, farms, substations, rivers, water facilities, or remote locations.

This is the gap Favoriot is designed to help close.

The objective is simple:

Prototype → Real Site → Operational Pilot → Multiple Sites → Enterprise

Let me explain how to move through these stages practically.

Step 1: Start With the Operational Problem, Not the Technology

Before adding more features to your prototype, return to the original problem.

Ask yourself:

  1. What problem are we trying to detect or prevent?
  2. Who experiences this problem?
  3. How is the problem being handled today?
  4. What information is currently missing?
  5. How quickly must someone know when something goes wrong?
  6. Who should respond when an abnormal condition occurs?
  7. What measurable improvement should the IoT system produce?

Suppose you have built a temperature monitoring prototype.

The technical description might be:

“Our ESP32 sends temperature readings through MQTT every 30 seconds.”

That is useful for developers, but it does not explain why an organisation should deploy it.

The operational description is much stronger:

“Maintenance personnel currently discover overheating equipment during scheduled inspections. Our system continuously monitors temperature and alerts them when abnormal conditions occur.”

Now we have a reason for the technology to exist.

Before putting your prototype into operation, make sure you can explain the operational problem in one or two sentences.

Step 2: Keep the Parts of Your Prototype That Already Work

Moving from prototype to operation does not mean throwing everything away and starting again.

If something already works reliably, keep it.

Your existing solution may already include:

  • Sensors
  • ESP32 or Arduino devices
  • Raspberry Pi
  • Industrial gateways
  • PLC interfaces
  • LoRa or LoRaWAN devices
  • Cellular connectivity
  • Wi-Fi
  • Custom hardware
  • Existing firmware

The question is not:

“How do we rebuild everything?”

The better question is:

“What is missing between this working prototype and an operational deployment?”

Very often, the missing piece is not another sensor.

It is the software and operational structure surrounding those sensors.

Your architecture begins moving from:

Sensor → Dashboard

towards:

Sensor → Device → Network → Favoriot → Rules → Dashboard → Alert → User → Action

That is a much more realistic operational architecture.

Step 3: Connect Your Devices to Favoriot

Once your hardware is working, the next step is to move the device data into a platform that can support the project as it grows.

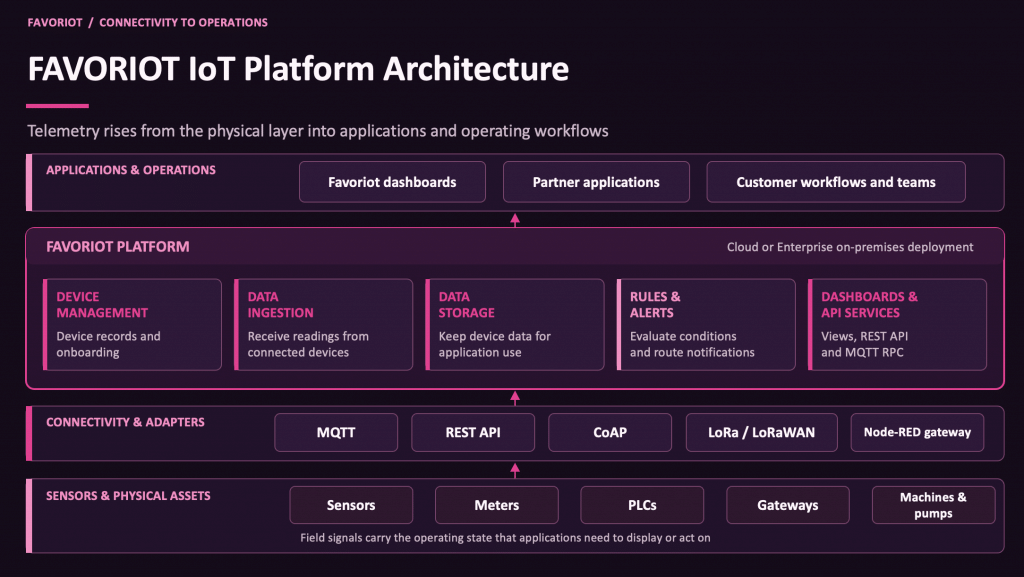
Favoriot can provide the common platform layer between your devices and applications.

A simple architecture could look like this:

Sensors

Microcontroller / Gateway

Wi-Fi / Cellular / LoRaWAN / Network

MQTT / REST API

Favoriot

Dashboard / Application / Alerts / Analytics

This means developers and system integrators do not need to build every software component themselves before putting the project at a customer site.

You can concentrate on solving the customer’s problem while Favoriot handles the IoT platform layer.

Step 4: Design for 100 Devices Even If You Currently Have Only One

A prototype normally starts with one device.

That is perfectly fine.

But operational deployment requires you to start thinking about a fleet of devices.

Imagine that your prototype monitors river levels.

Today:

  • 1 sensor
  • 1 ESP32
  • 1 dashboard
  • 1 developer

Tomorrow:

  • 10 monitoring stations
  • 20 sensors
  • multiple gateways
  • several users
  • multiple dashboards
  • different alert thresholds

Later:

  • 100 monitoring locations
  • hundreds of devices
  • multiple districts
  • different maintenance teams
  • management dashboards
  • external applications

The question therefore changes.

Instead of asking:

“Is my sensor sending data?”

you need to ask:

  • Which devices are online?
  • Which devices have stopped sending data?
  • Which device belongs to which location?
  • How frequently should each device report?
  • What happens when communication is interrupted?
  • Who can access each dashboard?
  • How long should data be retained?
  • Which applications need access to the data?
  • What happens when we add another 100 devices?

You do not necessarily need 100 devices today.

You simply need to avoid designing something that becomes impossible to manage when the project succeeds.

Step 5: Turn Sensor Data Into Operational Information

Connecting devices is only the beginning.

Consider this reading:

Temperature: 67.3°C

Interesting.

But what should someone do with it?

An operational system needs context.

For example:

  • Normal operating temperature: below 50°C
  • Warning level: 50°C to 60°C
  • Critical level: above 60°C
  • Current reading: 67.3°C
  • Equipment status: Critical
  • Required action: Maintenance inspection

Now the data means something.

A practical operational flow might become:

Sensor detects abnormal condition

Device sends data

Favoriot receives the reading

Rule identifies abnormal condition

Alert is generated

Responsible person receives notification

Maintenance team investigates

Problem is resolved

This is where IoT starts becoming operationally useful.

Step 6: Build Dashboards Around People, Not Sensors

One common prototype mistake is putting every available measurement onto a dashboard.

Temperature.

Humidity.

Voltage.

Current.

Battery.

Signal strength.

Timestamp.

Device ID.

Pressure.

Flow rate.

Everything gets a graph.

It looks impressive during a demonstration. Unfortunately, the person operating the system may have no idea where to look first.

Instead, design dashboards according to roles.

For technicians

Show information such as:

  • Device status
  • Current readings
  • Battery level
  • Communication status
  • Recent alarms
  • Sensor history

For operations managers

Show:

  • Number of active sites
  • Current abnormal conditions
  • Unresolved alerts
  • Site performance
  • Historical trends
  • Response status

For senior management

Show:

  • Major operational exceptions
  • Performance indicators
  • Downtime trends
  • Operational risks
  • Cost or resource implications

The dashboard should answer one basic question:

“What do I need to know or act upon right now?”

Step 7: Add Useful Alerts Before Fancy AI

There is often pressure to put AI into everything.

I would resist that temptation at the beginning.

First, make sure the organisation can reliably detect simple abnormal conditions.

For example:

  • Temperature exceeds 60°C.
  • Water level reaches a dangerous threshold.
  • Electricity consumption suddenly increases.
  • Pressure falls below normal.
  • A device has stopped transmitting.
  • Battery level becomes critically low.
  • A pump operates longer than expected.
  • A machine starts behaving outside its normal operating range.

These may appear simple, but they can solve very expensive problems.

Once sufficient operational data has been collected, more advanced analysis can become useful for detecting patterns, forecasting problems, identifying anomalies, or supporting decisions.

The sequence should normally be:

Collect → Monitor → Alert → Understand → Predict

rather than:

Prototype → AI

Step 8: Put It Into One Real Site

Now comes the important part.

Take the prototype out of the laboratory.

Choose one real operating environment.

Do not immediately deploy across 50 locations. Start with somewhere small enough to manage but real enough to expose problems.

At the site, test things that laboratory demonstrations rarely reveal:

  1. Connectivity
    • Is Wi-Fi reliable?
    • Is cellular coverage sufficient?
    • Are there dead zones?
  2. Power
    • What happens during outages?
    • Can devices restart automatically?
  3. Sensors
    • Are readings stable?
    • Does weather affect them?
    • Do they require recalibration?
  4. Hardware
    • Can enclosures handle heat, rain, dust, or vibration?
    • Are cables properly protected?
  5. Users
    • Do people understand the dashboard?
    • Are alerts meaningful?
    • Are there too many notifications?
  6. Operations
    • Who responds?
    • How quickly?
    • What happens after an alert?

You will probably discover things you never expected.

Good.

That is exactly why the real-site stage exists.

Step 9: Turn the Real-Site Test Into an Operational Pilot

There is an important difference between testing whether technology works and proving whether the technology solves an operational problem.

A pilot should have measurable outcomes.

Do not define success as:

“Twenty sensors successfully transmitted data for three months.”

That proves connectivity.

Instead, measure things such as:

  • Reduction in manual inspections
  • Faster detection of abnormal conditions
  • Faster response times
  • Reduced downtime
  • Reduced energy consumption
  • Reduced water losses
  • Reduced equipment failures
  • Better maintenance planning
  • Fewer unnoticed incidents

For example:

Before Favoriot

Technicians inspect equipment manually every four hours.

After deployment

Equipment is monitored continuously and maintenance personnel receive alerts when abnormal conditions occur.

That tells management why the project matters.

Step 10: Prove the Business Value Before Expanding

This stage is often forgotten.

A technically successful pilot does not automatically become a commercial project.

Before asking the customer to expand, build a simple business case.

Document:

  1. The original problem
  2. How the problem was previously handled
  3. What was deployed
  4. What Favoriot monitored
  5. What abnormal conditions were detected
  6. What actions were taken
  7. What improved
  8. What money, time, resources, or risks were reduced
  9. What expansion would cost
  10. What the organisation gains from expansion

The objective is to move the conversation away from:

“The technology works.”

towards:

“The organisation benefits from using it.”

That difference can determine whether your pilot ends with a presentation or continues into a real project.

Step 11: Expand Carefully

Once the pilot proves operational value, you have evidence to justify expansion.

A sensible progression is:

1 Prototype

1 Real Site

5 Sites

1 Department

Multiple Departments

Organisation-wide Deployment

Multiple Locations

At each stage, learn before expanding again.

Do not simply multiply the number of sensors. Improve the operating model as well.

Ask:

  • Who owns the system?
  • Who maintains the devices?
  • Who receives alerts?
  • Who handles technical support?
  • Who manages users?
  • Who reviews performance?
  • Who decides when more sites should be added?

Technology can scale quickly.

Organisations usually scale more slowly.

Plan for both.

Step 12: Move Towards Favoriot Enterprise When the Project Requires It

As deployment grows, organisations may require more control over their IoT environment.

The conversation may expand into:

  • Enterprise deployment
  • User management
  • Data ownership
  • Security requirements
  • Custom dashboards
  • API connections
  • Existing enterprise applications
  • Multiple sites
  • Larger device fleets
  • On-premise requirements
  • Internal operational workflows

At this point, Favoriot can become part of the organisation’s wider operational architecture rather than simply the platform used during prototyping.

The progression becomes:

Favoriot for Prototype

Favoriot for Pilot

Favoriot for Department

Favoriot for Organisation

Favoriot Enterprise

The important point is that you do not have to make this jump on day one.

Grow the architecture together with the project.

Step 13: For System Integrators, Build What Makes You Valuable

Many system integrators may hesitate to enter IoT because they believe they need their own large software development team.

You do not necessarily need to build an IoT platform yourself.

Your strengths may already be elsewhere.

You can focus on:

  1. Customer relationships
  2. Understanding the customer’s operational problems
  3. Site surveys
  4. Sensors and hardware
  5. Connectivity
  6. Installation
  7. System configuration
  8. Industry knowledge
  9. Training
  10. Support and maintenance

Favoriot can provide the IoT platform underneath the solution.

This creates a simple partnership model:

You own the customer. You understand the problem. You deliver the solution. Favoriot powers the IoT platform.

Instead of spending months building platform functions, your team can spend more time winning customers and solving their operational problems.

The Complete Prototype-to-Operation Checklist

Before moving your prototype into operation, ask whether you have completed these steps:

Problem

  • Have we clearly defined the operational problem?
  • Do we know who experiences it?
  • Do we know what improvement we want?

Technology

  • Are the sensors reliable?
  • Is the hardware suitable for the actual environment?
  • Is connectivity reliable?
  • Can devices recover from failures?

Platform

  • Are devices connected to Favoriot?
  • Is data structured properly?
  • Can devices be managed as the deployment grows?

Visibility

  • Are dashboards designed for actual users?
  • Can users quickly identify abnormal conditions?

Alerts

  • Have meaningful thresholds been defined?
  • Does the correct person receive the alert?
  • Is there a clear response process?

Pilot

  • Has the system been tested at a real site?
  • Has it operated long enough to expose practical problems?
  • Have actual users tested it?

Value

  • Can we measure operational improvements?
  • Can we show what time, cost, effort, or risk has been reduced?
  • Is there a business case for expansion?

Scale

  • Can we move from one site to multiple sites?
  • Who owns and maintains the system?
  • Is there a plan for enterprise deployment?

If you cannot answer some of these questions yet, that is not necessarily bad news.

It simply tells you what needs to happen next.

A Simple Favoriot Path From Prototype to Operation

If I had to reduce the entire process to one practical roadmap, it would be this:

1. BUILD

Create your working IoT prototype.

2. CONNECT

Connect the devices to Favoriot using MQTT or REST API.

3. SEE

Create dashboards that show what is actually happening.

4. ALERT

Define conditions that require human attention.

5. DEPLOY

Install the system at one real site.

6. LEARN

Observe hardware, connectivity, data, user, and operational issues.

7. PROVE

Measure whether the system solves the original operational problem.

8. EXPAND

Move from one site to several sites.

9. OPERATE

Establish ownership, maintenance, alerts, support, and operating procedures.

10. SCALE

Move towards departmental, organisation-wide, or Favoriot Enterprise deployment.

Your Prototype Is Not the Finish Line

There is something satisfying about watching the first sensor reading appear on a screen.

For developers, students, researchers, and engineers, that moment feels like success.

And technically, it is.

But I have learned that the bigger opportunity begins after that moment.

The question is no longer whether we can connect a device.

The question becomes whether we can turn that connected device into something an organisation depends on every day.

That means moving beyond sensors and dashboards towards operational visibility, alerts, actions, measurable outcomes, and a system that can continue working when the developer who built the original prototype is no longer standing beside it.

This is where Favoriot wants to help developers, researchers, startups, universities, and system integrators cross the difficult gap between “It works” and “We use it every day.”

So if your prototype already works, resist the temptation to keep adding features simply because you can.

Take it somewhere real.

Connect it.

Test it.

Break it.

Fix it.

Measure what changes.

Prove its value.

Then scale it.

Your prototype works. Now put it into operation.

If you have an IoT prototype sitting in your laboratory, office, university, or workshop and you are wondering how to move it to a real site, share your biggest challenge in the comments. I would be interested to hear what is stopping your project from taking that next step, because sometimes the most difficult part of IoT is not building the prototype. It is making sure the prototype gets the chance to become something real.

How to Estimate the Cost of a Blind Spot

How to Estimate the Cost of a Blind Spot (Operational Blindness)

August 13th, 2026 Posted by BLOG, HOW-TO, Internet of Things, Operational Blindness 0 thoughts on “How to Estimate the Cost of a Blind Spot (Operational Blindness)”

Most organizations never calculate what their blind spots actually cost them. Delays, uncertainty, repeated failures, manual checking, rework, energy waste, missed alerts, and poor reporting all get accepted as normal operating friction. Nobody puts a number on it because nobody is asked to.

This is the single biggest reason visibility projects stall at the budget stage. Without a number, a proposal to close a blind spot competes against every other line item as a nice-to-have. With a number, it becomes a comparison: the cost of staying blind versus the cost of seeing clearly. That comparison is what moves a project from “interesting” to “approved.”

This article walks through how to estimate the cost of a blind spot in a way that is defensible, fast enough to use in early discovery, and credible enough to bring to an executive.

Why the cost of blindness is rarely calculated

Operational blindness is invisible by definition. When a machine fails without warning, the organization sees the repair bill, not the six weeks of undetected wear that preceded it. When a report takes three days to compile manually, the organization sees the report, not the labor hours buried inside it. The cost is real, but it is scattered across departments, absorbed into “the way things are,” and rarely tied back to the missing visibility that caused it.

The estimate does not need to be perfect. In early discovery, it needs to be clear enough to show whether the problem deserves attention at all. A rough number that says “this blind spot is costing roughly RM 40,000 a month” is more useful than a precise number that takes three months to produce.

The six cost areas to check

Blind spots rarely cost money in only one way. Before estimating, work through these six areas and ask which ones apply to the specific blind spot in front of you.

Downtime. How many hours are lost per month because a failure or deviation was detected late instead of early? This is usually the most visible cost and the easiest to find in maintenance logs, production records, and incident reports.

Energy waste. Which assets consume energy without producing business value, because nobody can see they are running idle, overcooling, or malfunctioning? Meter data, equipment schedules, and occupancy records usually hold the answer.

Manual work. How many staff hours go into checking, copying, or reconciling data that should already be visible? Look at the report process itself, who owns each step, and how long the spreadsheet trail has been in place.

Compliance risk. Which metrics are hard to prove during an audit because the underlying data was never captured automatically? Regulatory reports, source records, and exception files reveal where the gaps sit.

Response delay. How long passes between an event happening and someone acting on it? Alert logs, communication records, and workflow timestamps show the real lag, which is usually longer than anyone assumes.

Customer impact. Which visibility gaps show up in complaints, missed service levels, or support tickets? This is the cost area most likely to be underestimated, because it shows up as churn and reputation damage rather than a line item.

A single blind spot can touch more than one of these areas at once. A missed maintenance alert, for example, carries downtime cost, energy waste, and customer impact together. Estimating each area separately and then adding them keeps the final number honest instead of inflated.

A simple estimation method

For each cost area that applies, work through three questions.

First, how often does the blind spot occur. A weekly event and a quarterly event carry very different annualized costs, so get a real frequency, not an impression.

Second, what is the cost per occurrence. This can be a repair bill, a headcount hour rate multiplied by hours lost, a wasted kilowatt-hour rate, or an estimated revenue impact per incident. Where a hard number does not exist, use a conservative range rather than skipping the category.

Third, multiply frequency by cost per occurrence to get an annualized figure for that area, then sum across all applicable areas.

This produces a defensible range, not a single decimal-point figure, and a range is exactly what is needed at this stage. Precision comes later, once instrumentation is in place and the numbers can be measured directly instead of estimated.

Where to get the evidence

Estimates built on guesses do not survive a conversation with finance. Each cost area has a natural evidence trail already sitting inside the organization.

Downtime numbers live in maintenance logs, production records, and incident reports. Energy waste shows up in meter data, equipment schedules, and occupancy records. Manual work is documented, even informally, in the report process itself, staff roles, and spreadsheet history. Compliance risk is visible in regulatory reports, source records, and exception files. Response delay is timestamped in alert logs, communication records, and workflow systems. Customer impact is already tracked in complaints, SLA records, and service tickets.

Asking for recent, specific examples produces better numbers than asking for general opinions. What happened last week. Which asset failed most recently. Which report arrived late. Which alert was missed. Which customer complained. Recent stories carry texture that a broad estimate cannot, and they anchor the cost calculation to something real rather than theoretical.

Turning the number into a decision

Once the cost of blindness is visible, the conversation changes shape. The project stops being a request to buy a platform or add sensors, and becomes an investment case to reduce a specific, quantified risk or capture a specific, quantified opportunity.

The comparison that matters is simple: the cost of building visibility against the cost of remaining blind. If closing a blind spot costs less than what the blindness is already costing every year, the case makes itself. If it costs more, that is useful information too. It tells the team to look for a smaller blind spot with a clearer payback, or to combine several blind spots into one investment that clears the bar together.

This is also why the estimate belongs early in the discovery process, not at the end. It shapes which blind spots get prioritized, which stakeholders need to be in the room, and how the eventual proposal gets framed. A proposal built around a quantified cost of blindness reads as consultative rather than product-led. The organization sees its own problem reflected back with a number attached, and the number is what makes the next conversation, about budget, easy instead of speculative.

The habit worth building

The organizations that manage this well do not treat cost-of-blindness estimation as a one-time exercise before a project starts. They build it into how they evaluate every operational gap that surfaces afterward. Every missed alert, every delayed report, every manual reconciliation becomes a small case study, and over time the organization develops a working library of what blindness actually costs across its operations.

That library is worth more than any single estimate. It turns “we think this matters” into “here is what it has cost us before,” and that shift, from intuition to evidence, is what separates organizations that fund visibility projects from organizations that keep accepting friction as normal.

Cost of Blindness Calculator | FOBA
FOBA · Find Phase Tool

Cost of Blindness Calculator

Operational blindness has a cost, but most organizations never calculate it. Estimate what a blind spot is really costing across six areas, then compare it against the cost of closing it.

Estimated annual cost of blindness
RM 0
RM 0 / month
Cost areas active
0 / 6
areas with a non-zero estimate
Largest contributor
no data yet

Annual cost by area

Visibility investment comparison

The cost of visibility should be compared against the cost of remaining blind. Enter the estimated cost of the project that would close this blind spot.

VS
Enter a project cost to compare it against the estimated cost of blindness.
Based on FOBA Chapter 6.7, Finding the Cost of Blindness. Estimates are directional, meant to show whether a blind spot deserves attention, not a substitute for a full financial audit.

Reducing Machine-Downtime Blindness With Favoriot

August 11th, 2026 Posted by BLOG, HOW-TO, Internet of Things, IOT PLATFORM, Operational Blindness 0 thoughts on “Reducing Machine-Downtime Blindness With Favoriot”

The Afternoon Everything Stopped

A production line goes quiet at 2:14 in the afternoon. Nobody on the floor knows why yet. The supervisor is walking the line asking the operator what happened. The operator is checking the panel. Someone has already called the maintenance contractor, just in case, because waiting to find out feels riskier than being wrong. Forty minutes pass before anyone has a real answer, and by then the shift’s output target is no longer realistic.

I have watched a version of this scene play out in more factories than I can count, and what strikes me every time is that it is rarely a story about broken equipment. It is a story about not knowing. The machine had already been signaling something was wrong. A vibration pattern had drifted. A motor had been running hotter than usual for three days. A pressure reading had crept past its normal range that same morning. The information existed. It just was not seen by anyone who could act on it in time.

That gap between having data and having sight is what I call downtime blindness, and it is a far more expensive problem than most operations teams realize.

What Downtime Blindness Actually Costs

The numbers are worth sitting with for a moment. Fluke’s 2025 downtime survey found that manufacturers are losing up to $852 million a week industry-wide to unplanned outages, with the average hour of downtime running around $1.7 million once lost production, idle labor, and recovery costs are added up. A few figures from that same survey stand out:

  • Frequency: Nearly half of manufacturers report six to ten downtime incidents every single week.
  • Duration: 45% of outages last up to twelve hours, and 15% stretch as long as seventy-two.
  • Prevalence: More than six in ten manufacturers experienced unplanned downtime in the past year.

These are not rare, catastrophic failures. They are a steady drip of small stoppages that quietly adds up to a very large number by the end of the quarter.

More Sensors Is Not the Same as More Sight

The instinct when a plant hears numbers like these is to reach for more sensors, and I understand the appeal. More data feels like more control. But I have seen plants add a dozen new sensors and still get caught off guard by the same kind of stoppage six months later, because the new readings simply landed in yet another dashboard nobody had time to check.

Adding instrumentation without adding a way to see across it does not close the blindness. It just makes the blind spot slightly better lit.

Most plants are not actually short on data to begin with. Walk into any mid-sized facility and you will typically find:

  1. PLCs logging cycle times and machine states.
  2. Sensors tracking temperature, vibration, and pressure.
  3. SCADA systems recording alarms as they happen.
  4. Maintenance software full of work orders nobody has time to read.

The instrumentation exists. What is usually missing is a connected view that turns all of that into something a supervisor can glance at and understand in five seconds, not five separate screens.

The Problem Sensors Cannot Fix: Retiring Expertise

There is a second layer to this problem that gets less attention than it deserves, and it has nothing to do with sensors at all. It is about people.

A recent industry analysis pointed out that a large share of manufacturing maintenance teams are watching their most experienced technicians retire, and that junior technicians can take three to three and a half times longer to diagnose the same fault. The instinct an experienced tech develops after twenty years, the ability to hear a bearing going bad before it shows up on any gauge, does not transfer automatically to the next generation. When that knowledge walks out the door, the plant does not just lose a person. It loses a diagnostic capability that took decades to build, and the blindness gets worse even though the sensors stay exactly the same.

So the real question is not whether a factory has enough data. It is whether that data has been connected into something the whole team can see and act on together, in a way that does not depend entirely on one person’s memory of what a strange noise usually means.

Connect, See, Act: Closing the Gap

This is the exact gap we built Favoriot to close, and I want to be specific about how rather than just asserting it. Our approach follows a simple sequence.

Connect. Pull readings from machines, PLCs, and existing sensors into one place, regardless of whether that equipment is ten years old or ten weeks old. Most plants run a mix of both and cannot afford to rip out working hardware just to gain visibility.

See. Turn that raw stream into a live picture of asset health that a supervisor, a plant manager, and a maintenance planner can all look at and immediately understand, rather than three different systems each showing part of the truth.

Act. The platform does not stop at a chart. It flags the anomaly before it becomes a stoppage, routes it to the right person, and keeps a record of what happened so the next technician facing a similar pattern does not have to start from zero.

That last part matters more than it might sound. Every alert that gets resolved becomes a small piece of institutional memory. Over time, a plant using this kind of system is not just catching problems earlier, it is quietly building the same kind of pattern library that used to live only in a veteran technician’s head. That is a meaningful answer to the retirement problem above, and it has nothing to do with predicting the future perfectly. It is about making sure knowledge does not evaporate every time someone retires or moves on.

What Visibility Can and Cannot Do

I want to be honest that visibility alone will not fix every downtime problem. Some failures are mechanical and will happen regardless of how good your monitoring is. Some are caused by upstream supply issues that no sensor can see coming.

What a connected view does is shrink the forty minutes of confusion down to something closer to four, because the moment the line stops, someone already knows what changed, when it started drifting, and what the last three similar incidents looked like. That compression, from confusion to clarity, is where most of the real savings live. It is rarely about preventing every failure. It is about not being blind for the first half hour of one.

Three Questions Worth Asking Your Own Floor

If you are running operations and want a quick gut check on where your plant stands, ask yourself:

  1. When a machine stops, how long does it typically take before someone knows the root cause rather than just the symptom?
  2. If your most experienced technician left tomorrow, how much of their troubleshooting knowledge is actually written down anywhere your team can access?
  3. Do your current monitoring tools give you one connected picture, or are they five separate screens that nobody has time to check at once?

Most plants I talk to already know the answers, and the answers are usually not comfortable ones. That discomfort is a good sign, honestly, because it means the problem is visible enough to fix. I would rather have a plant manager tell me their monitoring is fragmented than have them tell me everything is fine, because the second answer usually means nobody has looked closely enough yet.

Start Small, Prove It Fast

The plants that make real progress on this rarely do it in one big overhaul. They usually start with the single line or the single asset class that causes them the most grief, connect it properly, and let the team get comfortable with what a clear picture actually feels like before expanding further.

That approach also tends to build internal trust faster, because operators and technicians can see the tool catching something real in week one rather than waiting months for a plant-wide rollout to prove itself.

If any of this sounds familiar and you want to see what a Connect, See, Act view of your own floor could look like, we are always happy to walk through it with you. No pressure, just a conversation about where your blind spots actually are.

Copyright © 2026 All rights reserved