Posts tagged "middleware"

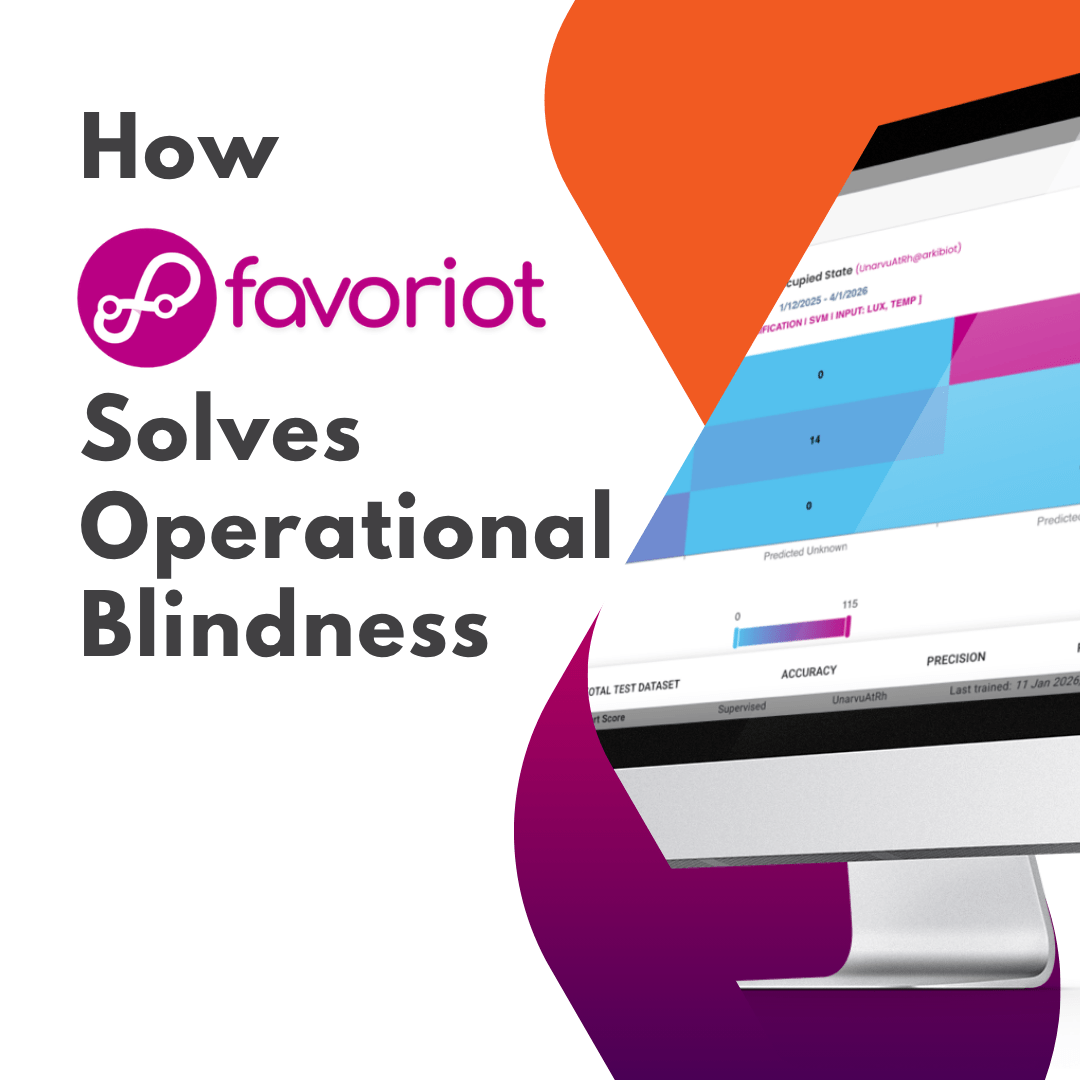
How Favoriot Solves Operational Blindness

July 29th, 2026 Posted by BLOG, HOW-TO, Internet of Things, IOT PLATFORM, Operational Blindness 0 thoughts on “How Favoriot Solves Operational Blindness”
How Favoriot Solves Operational Blindness
Favoriot
Operational Visibility Platform
Whitepaper · 2026

How Favoriot SolvesOperational Blindness

A practical framework for turning disconnected IoT signals into trusted operational context, accountable action and measurable outcomes.

Prepared by FavoriotConnect. See. Act.
Author perspectiveDr. Mazlan Abbas, CEO and Co-founder
3Connected capabilities: Connect, See, Act
13Sections covering method, delivery and outcomes
5Phase delivery roadmap for the first pilot
6Success measures across time, cost and ownership
Executive Summary

Connected organisations can still be blind

Operational blindness occurs when an organisation has devices, data, dashboards and alerts, yet decision-makers still cannot tell what is happening, why it matters, who should respond or whether the response worked.

The organisation sees measurements. It does not yet see operational truth.

Favoriot addresses this gap by serving as the operational visibility layer between field devices and business action. It gathers data from sensors and gateways, attaches context to that data, presents role-based views, detects meaningful conditions, routes alerts to responsible people and preserves an evidence trail from signal to outcome.

The approach is organised around three connected capabilities: Connect operational assets, See the situation with context, and Act through workflows and accountability. This is supported by device management, data ingestion, dashboards, rules, alerts, APIs, reporting and partner-led deployment services.

1. Definition

What is operational blindness?

Operational blindness is the condition where an organisation collects operational data at scale but still cannot make confident, timely decisions because the data does not close the loop to action.

1

Data without context

Readings arrive, but teams cannot see what is normal, abnormal, urgent or related to a specific asset, process or service level.

2

Insights without workflow

Information stays in dashboards and reports instead of entering maintenance, escalation, compliance or service processes.

3

Alerts without action

Notifications are sent, but ownership, acknowledgement, escalation, resolution and learning are not consistently recorded.

2. Symptoms

How operational blindness appears in daily work

Too many dashboards, too little clarity

Each department sees its own screen, while the end-to-end operating picture remains fragmented.

Problems are found through complaints

Customers, operators or auditors discover failures before the monitoring system triggers a useful response.

Manual checking remains the safety net

Staff still rely on spreadsheets, phone calls, WhatsApp groups and physical inspections to confirm what systems should already know.

Alerts become background noise

Thresholds generate many low-value notifications. Critical events are hidden among repetitive or poorly prioritised alarms.

Decisions depend on individual memory

The organisation cannot preserve operational knowledge when experienced staff are unavailable or leave.

Reports explain yesterday

Management receives summaries after the opportunity to prevent downtime, loss, waste or service failure has passed.

3. Favoriot Method

The Connect, See, Act operating model

Favoriot is positioned not merely as a place to store sensor data, but as the operating layer that shortens the distance between an event occurring and the right person taking the right action.

Stage 1

Connect

Bring devices, gateways, protocols and external systems into a common data environment.

MQTTHTTP/RESTGateways
Stage 2

See

Turn measurements into operational meaning using context, dashboards, rules and history.

DashboardsRulesTrends
Stage 3

Act

Route exceptions into alerts, escalation and accountable workflows, then record the result.

AlertsAPIReports
4. Connect

Create a dependable operational data foundation

Operational visibility begins with trustworthy data capture. Favoriot accepts telemetry from many device types, gateways and network arrangements, allowing organisations to connect brownfield and new deployments without forcing every use case into one hardware design.

  • Device registration and lifecycle management
  • Telemetry ingestion through common IoT protocols
  • Cloud or enterprise deployment options
  • Multi-site and multi-tenant organisation
  • APIs for business systems, analytics and reporting
  • Gateway support for field protocol conversion

What this cures

Missing data: blind spots caused by unconnected assets.

Data silos: separate readings that cannot be compared.

Weak traceability: uncertainty about device identity, source and time.

Scaling friction: each new site needing a new monitoring stack.

5. See

Convert telemetry into operational meaning

Raw readings rarely carry enough meaning for an operations manager. Favoriot helps organise data around assets, sites, conditions and responsibilities so that the user can distinguish routine variation from a developing risk.

Context

Relate each reading to its device, asset, location, process, baseline and operating limit.

Role-based views

Present the same operational truth differently for technicians, managers, executives and customers.

History and trends

Show patterns over time so teams can detect drift, recurring faults and early warning signals.

Rules

Identify combinations of readings that matter, rather than relying only on simple single-value thresholds.

Evidence

Preserve time-stamped records for audit, compliance, service review and root-cause analysis.

Shared picture

Give stakeholders one common reference instead of conflicting spreadsheets and informal updates.

6. Act

Make every important signal actionable

Visibility creates business value only when it changes what people do. Favoriot supports the movement from detection to acknowledgement, escalation, response and closure.

Operational eventPlatform responseHuman or system actionEvidence retained
Cold-room temperature risesRule validates persistence and severityNotify duty technician, escalate if unacknowledgedEvent time, acknowledgement, response and recovery
Machine vibration driftsTrend indicates developing abnormalityCreate maintenance inspection or work requestTrend, intervention and post-maintenance condition
Water level crosses risk bandSite, rainfall and level are shown togetherNotify response team and relevant authorityAlert path, decision time and field update
Indoor air quality degradesThreshold and duration rule triggersAdjust ventilation and inform facility managerBefore-and-after readings and action record
7. Closed-Loop Accountability

The difference between an alert and an outcome

Many monitoring systems stop when a notification is sent. That is where operational blindness often begins. A closed loop continues until someone owns the issue, responds, confirms the result and records what was learned.

A

Acknowledge

Confirm that the responsible person or team has received and accepted the issue.

R

Respond

Capture what action was taken, by whom, and within which service or safety target.

V

Verify

Use fresh operational data to confirm that the action restored the required condition.

8. Platform and Partner Roles

Favoriot is the engine. The solution partner drives delivery.

Operational blindness is not solved by software alone. Successful delivery combines Favoriot’s platform capabilities with field engineering, domain knowledge, workflow design and customer ownership.

FavoriotSystem Integrator or Solution PartnerCustomer
Data ingestion, device management and platform servicesSensor selection, installation and field networkingBusiness priorities and risk tolerance
Dashboards, rules, APIs, alerts and data historyDomain configuration, workflow design and local supportDecision ownership and operating procedures
Scalable cloud or enterprise platform foundationSolution packaging, commissioning and managed serviceResponse teams, escalation paths and performance targets
9. Delivery Roadmap

Start with one decision that matters

The recommended starting point is not a large platform replacement. It is a focused operational visibility pilot built around a costly, frequent or high-risk decision.

1. Diagnose the blind spot

Identify the operational question that teams cannot answer reliably today. Map missing signals, delayed information, unclear ownership and current workarounds.

2. Define the decision and response

Agree what condition requires attention, who owns it, how quickly they must respond and what evidence proves closure.

3. Connect the minimum data set

Deploy or connect only the sensors and systems needed to support the selected decision.

4. Configure visibility and action

Create dashboards, contextual rules, alerts, escalation and reporting around the operating process.

5. Measure and expand

Compare response time, downtime, losses, manual effort, compliance and service outcomes before and after the pilot.

10. Success Measures

Measure improved decisions, not just connected devices

MTTDMean time to detect a meaningful operational condition
MTTAMean time for the responsible person to acknowledge
MTTRMean time to respond, recover or resolve
%Critical events with a named owner and recorded closure
RMAvoided loss from downtime, spoilage, waste or service failure
HoursManual inspection and reporting time removed
11. Use Cases

Where Favoriot can reduce operational blindness

High relevance

Smart buildings

HVAC performance, indoor air quality, energy, equipment condition, leaks and occupant comfort.

High relevance

Manufacturing

Machine health, production conditions, downtime causes, utility consumption and maintenance response.

High relevance

Cold chain and logistics

Temperature excursions, storage conditions, delivery handovers, asset location and compliance evidence.

Emerging

Water and environmental monitoring

Water levels, quality indicators, remote assets, flood risk, emissions and regulatory reporting.

Emerging

Agriculture

Soil, weather, irrigation, fertigation, livestock conditions and farm-to-fork traceability.

Emerging

Smart cities and public services

Distributed assets, service incidents, multi-agency visibility and response coordination.

12. Why Favoriot

Built to connect operational data with real work

IoT-native foundation

Favoriot is designed for device data, telemetry, rules, dashboards and operational events rather than being adapted from a general reporting tool.

Flexible deployment

Organisations can adopt cloud services or enterprise deployment based on data, governance and operating requirements.

Partner-ready delivery

System integrators can combine Favoriot with their field expertise, hardware, services and managed support.

Outcome-based positioning

The platform is framed around decision speed, accountability and operational evidence, not the number of dashboard widgets.

Favoriot helps organisations move from connected assets to visible operations, and from visible operations to accountable action.

13. Recommended First Engagement

Operational Blindness Discovery Workshop

A short discovery workshop can identify one practical starting point and build agreement across operations, IT, management and the delivery partner.

Five decision questions

  • Which operational event causes the greatest avoidable cost or risk?
  • How is that event detected today?
  • What information is missing, delayed or distrusted?
  • Who owns the response and escalation?
  • What result proves the issue has been resolved?

Workshop outputs

  • Operational blindness assessment summary
  • Top operational blind spots
  • Visibility gap map
  • Estimated business impact
  • Recommended pilot and high-level architecture
  • Success metrics and measurement plan

Malaysia’s Operational Blindness Report 2026

July 29th, 2026 Posted by BLOG, Internet of Things, IOT PLATFORM, Operational Blindness 0 thoughts on “Malaysia’s Operational Blindness Report 2026”
Malaysia Operational Blindness Report 2026

MALAYSIA’S
OPERATIONAL BLINDNESS
REPORT 2026

From scattered data to operational visibility
A strategic report for Malaysian industry leaders, government agencies, utilities, asset owners, system integrators and technology providers

Executive Summary

Malaysia is becoming a highly connected economy. Factories install sensors. Buildings have management systems. Utilities collect meter readings. Local councils operate command centres. Companies publish sustainability reports. Farms monitor weather and soil conditions.

On paper, Malaysia appears to have plenty of data. Yet many organisations still do not know what is happening across their operations until somebody makes a call, sends a WhatsApp message, opens a spreadsheet or travels to the site.

This is Operational Blindness: the gap between what an organisation collects and what its people can actually see, trust and act on.

Malaysia is not short of technology spending. ICT and e-commerce contributed RM451.3 billion to the economy in 2024 [1]. The harder question is whether that spending helps organisations detect problems earlier, understand conditions across sites, reduce waste and prove that reported performance matches reality.

The 2026 assessment identifies seven hotspots: water and utilities, manufacturing, buildings, flood and environmental monitoring, agriculture, local government and ESG reporting. Malaysia does not need another wave of isolated dashboards. It needs a stronger connection between data, visibility, responsibility and action.

“The organisation has data, but the operation is still invisible.”
RM451.3b ICT and e-commerce contribution in 2024 [1]
3,000 smart factories targeted by 2030 [3]
37.1% national non-revenue water rate reported for 2023 [6]
1,345 flood incidents in 2024 [8]

1. What Operational Blindness Means

Operational Blindness is the inability to continuously see, understand and respond to conditions across physical operations. It appears when an organisation owns data, systems and dashboards, yet still depends on telephone calls, WhatsApp messages, spreadsheets or site visits to find out what is happening.

An organisation can be digitally advanced and still operationally blind. A factory may use AI in the head office while technicians still write readings on paper. A city may have a command centre while departments keep separate databases. A building may have a Building Management System while energy, air quality, occupancy and maintenance records remain disconnected.

The presence of technology does not automatically create visibility. Visibility exists only when trusted data reaches the right person, in time, with a clear response attached.

2. Malaysia’s Position in 2026

Malaysia enters 2026 with strong national ambitions in digitalisation, AI, industrial automation and sustainability. ICT and e-commerce contributed 23.4% or RM451.3 billion to Malaysia’s economy in 2024, growing 5.1% compared with 3.5% in the previous year [1]. Malaysia Digital investments also continued to attract capital and new digital companies [2].

The New Industrial Master Plan 2030 targets the transformation of 3,000 smart factories by 2030 [3]. Malaysia’s National Sustainability Reporting Framework is pushing companies towards more consistent, comparable and reliable sustainability disclosures [4][5].

These programmes create a large opportunity, but they also expose a basic weakness. AI, predictive analytics and credible ESG reporting depend on continuous, trustworthy operational data. Where field data is incomplete, delayed or fragmented, advanced analytics will produce confident answers from an incomplete picture.

3. Seven Operational Blindness Hotspots

3.1 Water and Utility Management

High

Water losses, distributed assets and incomplete field visibility

Water management is one of the clearest examples. Malaysia’s national non-revenue water rate was reported at 37.1% in 2023, representing about 7,195 million litres of treated water lost each day and more than RM2 billion in annual losses [6].

The visibility gap often lies between production meters, district meters, customer meters and maintenance records. A pipe can leak underground for weeks while the control room still appears normal.

Priority actions include pressure monitoring, district metering, reservoir-level monitoring, pump-condition monitoring, abnormal consumption alerts and better connection between telemetry and field maintenance. Air Selangor reported reducing non-revenue water from 33.2% in 2017 to 27.8% in 2023, showing what sustained measurement and intervention can achieve [7].

3.2 Manufacturing and Industrial Operations

High for SMEs; Moderate for larger plants

Legacy machinery, isolated control systems and manual inspection

Malaysia’s smart-factory target will increase demand for machine connectivity, energy monitoring, production visibility and condition-based maintenance [3]. Yet many factories still operate with a mixture of legacy machines, standalone PLCs, handwritten forms, vendor portals and spreadsheets.

Management may know total daily production but not which machine consumes too much energy, which motor shows abnormal vibration, why a line stopped, or how long equipment operated outside its recommended range.

Favoriot should complement, not replace, safety-critical SCADA and control systems. The operational visibility layer can connect selected machine, meter and sensor data for wider analysis, alerting and management reporting.

3.3 Buildings and Facilities

High

Separate BMS, energy, maintenance and tenant systems

Many Malaysian buildings have a Building Management System, yet owners still lack one view of electricity, indoor air quality, cooling performance, water usage, occupancy, lifts, pumps and maintenance.

Common symptoms include unusually high electricity bills without a clear cause, air-conditioning running in empty areas, water leaks discovered through complaints and maintenance based on fixed schedules instead of equipment condition.

The strongest business case is not the phrase smart building. It is lower operating cost, fewer complaints, earlier fault detection and less unplanned maintenance.

3.4 Flood, Environment and Disaster Monitoring

Moderate to High

Remote sensing points and multi-agency coordination

Malaysia recorded 1,345 flood incidents in 2024, compared with 809 in 2023 [8]. Flood-related losses were estimated at RM933.4 million in 2024 and RM636.9 million in 2025 [9].

The challenge is not simply the lack of weather reports. It is knowing what is happening at a specific river, drain, road, village or pump station at the right moment, and getting that information to the party responsible for action.

Useful capabilities include river and drain-level monitoring, rainfall sensing, pump status, road-water detection, CCTV verification, automatic alert escalation and equipment-health monitoring at remote stations.

3.5 Agriculture and Plantations

High

Remote sites, weak connectivity and manual reporting

Agricultural operations are spread across wide areas. Managers often rely on workers to report soil moisture, irrigation failures, pump status, fertiliser levels, weather and crop conditions.

The value is not the sensor by itself. The value comes from a useful warning such as: Irrigation Zone 4 has not received enough water during the last six hours, and soil moisture is approaching the crop stress threshold.

Priority applications include irrigation and fertigation monitoring, water-storage levels, pump condition, microclimate monitoring, cold-chain tracking and satellite-connected monitoring for remote areas.

3.6 Local Government and City Operations

High

Departmental silos, long procurement and unclear ownership

A city does not become operationally visible because it has a large video wall. Visibility must reach the officers repairing streetlights, clearing drains, collecting waste, maintaining facilities and responding to complaints.

City-wide platform programmes often slow down because of separate budgets, legacy systems, shifting priorities, data ownership questions and no single operational owner.

A more practical starting point is one measurable problem: reduce streetlight repair time, monitor flood-prone drains, track pump availability, improve public toilet maintenance or measure response time to complaints.

3.7 ESG and Sustainability Reporting

Moderate, rising quickly

Reported precision exceeds the quality of field data

The National Sustainability Reporting Framework is raising expectations for consistent, comparable and reliable sustainability information [4][5]. Yet much of the underlying data still comes from bills, spreadsheets, estimates, contractor reports and annual surveys.

This creates a risk that the sustainability report becomes more precise than the operation. A company may publish an exact carbon figure while individual buildings still rely on estimated consumption.

The next stage of ESG maturity requires automated energy and water collection, emissions monitoring, site-level evidence, digital audit trails and alerts when performance exceeds thresholds.

4. Five Root Causes

1. Data silos

Different departments procure separate systems that rarely share information.

2. Manual reporting

Employees collect readings, prepare spreadsheets and email reports, creating delay and error.

3. Technology without ownership

Sensors and dashboards are installed without naming who must respond.

4. Project-based procurement

Support, calibration, connectivity and maintenance weaken after the project ends.

5. Management-only dashboards

Monthly summaries look neat but do not help field teams act in time.

5. Malaysia 2026 Risk Assessment

The assessment below is directional. It helps leaders prioritise investigation and is not an official national ranking.

SectorBlindness RiskMain Reason
Water utilities HighLarge networks, leakage and incomplete field visibility
Manufacturing SMEs HighLegacy equipment and manual monitoring
Large manufacturers ModerateBetter automation, but systems remain fragmented
Commercial buildings HighSeparate building, energy and maintenance systems
Agriculture and plantations HighRemote assets and delayed field reporting
Local government HighDepartmental silos and complex ownership
Flood management Moderate to HighMulti-agency coordination and remote monitoring
Energy utilities ModerateStrong central monitoring but uneven asset-level visibility
Listed companies’ ESG reporting ModerateGrowing reporting pressure and fragmented source data
Healthcare facilities Moderate to HighMany critical systems with separate monitoring arrangements
Logistics and cold chain Moderate to HighGaps between warehouse, vehicle and customer systems
Malaysia has strong digital ambitions but uneven operational visibility.

6. The Cost of Operational Blindness

Operational Blindness creates two layers of cost. The first is easy to recognise because it appears in bills, repairs, downtime and losses. The second is harder to trace because it is buried inside delays, duplicated work, weak decisions and management time.

Visible CostsHidden Costs
Water and energy wasteDelayed decisions
Equipment breakdownRepeated site visits
Production downtimeLow trust in reports
Rejected productsDuplicate data entry
Emergency repairsDisputes between departments
Environmental penaltiesSlow investigations
Lost inventoryPoor customer experience
Property damageWeak sustainability evidence
Staff overtimeManagement time spent searching for information
The management problem: these costs are normally spread across maintenance, finance, operations and customer service. Each team sees one fragment, while senior management rarely sees the full price of the incident.

7. A Practical Response Playbook

1. Identify the blind spot

Ask which assets fail without warning, which readings are manual, which incidents arrive through WhatsApp, and which figures cannot be traced to a sensor or meter.

2. Start with a measurable use case

Choose a problem with a clear owner, visible cost or risk, available data and a practical response procedure.

3. Connect existing systems first

Reuse meters, PLCs, SCADA, BMS, sensors and databases where possible instead of replacing everything.

4. Design the alert-to-action process

Every alert must say what happened, where it happened, who must respond and what happens when nobody responds.

5. Measure operational outcomes

Track detection time, response time, downtime, site visits, resource savings, reporting hours and incidents prevented.

6. Expand after proof

Scale to other sites and functions after the first use case demonstrates operational value.

8. The Role of an Operational Visibility Platform

An Operational Visibility Platform acts as a shared layer between physical operations and the people who manage them. It can collect information from sensors, meters, industrial controllers, gateways, building systems, databases, third-party platforms and mobile applications.

CONNECT Bring together data from devices, systems and people.
SEE Present the right information to each user.
ACT Trigger alerts, work orders and decisions.

The platform should not replace every application. Its role is to reduce the gaps between them and give teams a common operational picture.

9. Why Choose Favoriot

9.1 Built for Operational Visibility

Favoriot is designed to shorten the gap between an operational event and the response that follows. It brings device data, trends, alerts and multi-site views into one shared layer so technical teams and management can work from the same operational picture.

9.2 Works With Existing Systems

Organisations do not need to discard working investments. Favoriot can receive data from sensors, smart meters, gateways, PLC-connected systems, SCADA, BMS, LoRaWAN networks, MQTT services, REST APIs and enterprise databases. This supports phased modernisation instead of an expensive rip-and-replace exercise.

9.3 From Data to Timely Action

Favoriot combines data ingestion, dashboards, historical trends, rules, alerts and APIs. The purpose is not simply to display readings. It is to help teams detect abnormal conditions earlier, assign responsibility and respond before a small issue becomes an expensive incident.

“Connect the operation. See what is changing. Act before the problem grows.”

9.4 Suitable for Multi-Site Operations

A single organisation may operate factories, buildings, farms, utility assets or remote facilities across many locations. Favoriot provides a common view while allowing each site, department or customer to see the information relevant to its role.

9.5 Cloud or On-Premises Deployment

Customers can select cloud deployment for faster rollout or an enterprise on-premises model when data residency, internal governance or private infrastructure is required.

9.6 Open APIs and Interoperability

Favoriot supports open connections to third-party devices and business applications. This reduces dependence on a single hardware supplier and allows operational data to support reporting, mobile applications, maintenance workflows, analytics and AI.

9.7 Trusted Operational Data for ESG and AI

ESG reporting and AI applications both depend on reliable field data. Favoriot can provide time-stamped records from meters, sensors and operational assets, helping organisations replace estimates and fragmented spreadsheets with traceable evidence.

9.8 Malaysian Expertise with Global Reach

Favoriot was developed in Malaysia and supports a community spanning more than 140 countries. Its experience covers government, enterprises, universities, system integrators, product developers and technology partners.

9.9 Start With One Blind Spot

The recommended approach is practical: identify one costly blind spot, connect the available data, define the alert-to-action process and measure the result. Once the first use case proves its value, the same platform can expand to more assets, sites and departments.

10. Outlook 2026-2029

Sustainability reporting

Companies will require more reliable environmental and climate data as the NSRF matures [4][5].

Smart-factory expansion

The 3,000 smart-factory target will raise demand for machine, energy and production data [3].

Rising utility costs

Organisations will need to find where resources are consumed or lost.

Climate and environmental risk

Floods and compliance needs will raise demand for continuous monitoring [8][9].

AI adoption

Useful AI depends on complete and trustworthy operational data.

Malaysia has spent years connecting people, businesses and government services. The next challenge is to connect the physical operation. Machines must reveal their condition. Buildings must show where resources are wasted. Water systems must expose losses. Farms must warn managers before crops are stressed. Sustainability reports must be supported by measured evidence.

Not another dashboard. Knowing what is happening before it is too late.

References

  1. Department of Statistics Malaysia, Malaysia Digital Economy 2025. https://www.dosm.gov.my/portal-main/release-content/malaysia-digital-economy-2025
  2. Malaysia Digital Economy Corporation, Malaysia Digital Investments Accelerates AI Nation by 2030. https://www.mdec.my/media-release/news-press-release/411/mdec%E2%80%99s-malaysia-digital-investments-accelerates-ai-nation-by-2030
  3. New Industrial Master Plan 2030, Mission-based Project: Transform 3,000 Smart Factories. https://www.nimp2030.gov.my/index.php/pages/view/110?mid=461
  4. Securities Commission Malaysia, National Sustainability Reporting Framework. https://www.sc.com.my/nsrf
  5. Securities Commission Malaysia, National Sustainability Reporting Framework to Enhance Sustainability Disclosures. https://www.sc.com.my/resources/media/media-release/national-sustainability-reporting-framework-to-enhance-sustainability-disclosures
  6. Ministry of Energy Transition and Water Transformation, Water Loss Asia 2024 Address. https://www.petra.gov.my/uploads/content-downloads/file_20250326115534.pdf
  7. Air Selangor Hydro Hub, Sustainable Water Management Practices Aimed at Reducing Water Loss. https://hydrohub.airselangor.com/publication/air-selangors-sustainable-water-management-practices-aimed-at-reducing-water-loss/
  8. National Disaster Management Agency, Flood Incidents Jump Sharply in 2024. https://www.nadma.gov.my/bi/media-en/news/5921-flood-incidents-jump-sharply-in-2024-amid-climate-impacts-dosm-finds
  9. National Disaster Management Agency, Malaysia Flood Damage Bill for 2024 and 2025. https://www.nadma.gov.my/bm/media-2/berita/6320-flood-losses-ease-malaysia-s-damage-bill-drops-from-rm933-4m-in-2024-to-rm636-9m-in-2025
  10. Malaysia Digital Economy Corporation, Malaysia Digital. https://mdec.my/malaysiadigital
  11. MyDIGITAL, Malaysia Digital Economy Blueprint and National Digital Direction. https://www.mydigital.gov.my/
  12. Favoriot, Operational Visibility Platform and IoT Platform Information. https://www.favoriot.com/
Favoriot

Contact Favoriot

Discuss your operational blind spots and possible pilot use cases.

Email: info@favoriot.com
Website: www.favoriot.com

Favoriot | Operational Visibility Platform | Malaysia Operational Blindness Report 2026

Why IoT Pilots Don’t Scale — And What You Can Do About It

May 29th, 2026 Posted by BLOG, HOW-TO, Internet of Things, IOT PLATFORM, PARTNER 0 thoughts on “Why IoT Pilots Don’t Scale — And What You Can Do About It”
Why IoT Pilots Don’t Scale — And What You Can Do About It | Favoriot Blog
Favoriot / Blog / Why IoT Pilots Don’t Scale
IoT Strategy

Why IoT Pilots Don’t Scale — And What You Can Do About It

Your sensors are working. Your dashboard is live. The demo went well. So why is the project still stuck at the same stage it was six months ago?

You have sensors sending data. You have a dashboard. And yet, when something goes wrong, people still ask — what actually happened? Here is how to close that gap in three steps.

You are not alone in this. It is the most common IoT story. The pilot worked. Everyone was impressed. Then the project quietly stalled — and now nobody can explain why.

Before you blame the technology, stop. The technology is rarely the problem. The way the pilot was designed is the problem. And the good news is — that is something you can fix.

The Pilot Was Designed to Impress, Not to Scale

Think about how most IoT pilots are run. You pick the best location. The cleanest use case. The most cooperative team. You run it for 90 days, generate a report, and declare success.

But a pilot that is built to impress is almost never built to scale.

The moment you try to replicate it — across ten buildings, fifty machines, or five departments — the gaps appear. The connectivity assumptions break. The integration that worked for one vendor’s device fails for another. The dashboard that one team used does not match how the next team works.

The uncomfortable truth

If your pilot did not ask “how would this work at full scale?” from day one, it was not really a pilot. It was a performance. And performances do not become operations.

Six Reasons Your IoT Pilot Is Still Stuck

  • 1

    Your data stops at the dashboard

    Sensors collect. Data flows. A chart appears. And then nothing. You have not defined what action should happen next. The dashboard is not the destination — it is just the beginning. If your pilot ends at the dashboard, it has not finished the job.

  • 2

    Nobody in the business owns the outcome

    Your IoT pilot lives in IT. But the results it is supposed to deliver belong to operations, facilities, or finance. When nobody in the business unit is accountable for the outcome, the project becomes an orphan after the initial excitement fades.

  • 3

    Your platform was built for one scenario

    Custom-built solutions work well for a single context. Try to extend them — new device types, new departments, new protocols — and the cost explodes. If you built everything from scratch for the pilot, you will have to build everything again for the next use case.

  • 4

    You measured the wrong things

    Uptime. Sensors connected. Data volume. These look technical and credible. But they do not tell you whether you made a better decision because of the data. Measuring the wrong things creates the illusion of success while the real problem stays unsolved.

  • 5

    Your team never learned how the system works

    The vendor set everything up. The vendor ran the pilot. Now the vendor has moved on. And your internal team is managing a system they never fully understood. Dependency without capability is not a deployment — it is ongoing helplessness.

  • 6

    Scaling was assumed, not planned

    Your pilot budget covered sensors and a dashboard. Nobody budgeted for integration, change management, training, platform licences at scale, or ongoing maintenance. Scaling was assumed to happen automatically. It never does.

IoT did not fail your organisation. The plan failed. And the plan failed because nobody designed it for the real world.

Here Is the Three-Step Path Forward

Scaling an IoT project is not about doing the same thing more times. It is a fundamentally different challenge. And it follows a clear path — one that most pilots skip halfway through.

Step 1 — Connect

Bring your devices into one place

Connect your sensors, machines, and systems into a single platform — regardless of vendor or protocol. You cannot see what you cannot reach. And you cannot scale what you cannot connect. The foundation must support multiple device types without requiring you to rebuild for every new scenario.

Step 2 — See

Turn data into something you can actually use

Build dashboards and analytics that show you what matters — not just what is happening. The right view for the right team. Real-time visibility into the assets and environments that affect your operations. This is where scattered data starts to become useful information.

Step 3 — Act

Let your data trigger a response

Set up alerts, automations, and AIoT intelligence that converts insight into action. This is the step most pilots never reach. And it is the only step that delivers real operational value. If your system cannot respond to what it sees, you have not finished building it.

Connect → See → Act. That is the full journey. A pilot that stops at Connect has only proven that sensors can send data. A deployment that reaches Act has proven that IoT works.

The Platform Question You Need to Ask Before Your Next Pilot

One of the most overlooked reasons pilots fail to scale is the platform itself.

If your IoT deployment is built on a single vendor’s proprietary stack, you do not fully own your project. You are renting access to it. And when you try to extend it — new devices, new use cases, new teams — the cost and complexity grow faster than the value.

Ask this before the pilot starts: “If we need to add a new device type or a new department in 12 months, what does that actually cost — in time, money, and effort?” The answer will tell you whether you are building something that can grow or something that will need to be replaced.

Four Questions to Ask Before You Approve Your Next Pilot Budget

Use these before the pilot — not after it stalls.

01
What specific decision will improve because of this data? If the answer is vague, the pilot will be vague.
02
Who in the business — not IT — is accountable for the outcome? If the answer is nobody, the outcome will be nobody’s problem.
03
Can the platform support ten times more devices without rebuilding? If the answer is no, you are planning for a demo, not a deployment.
04
What does full-scale deployment cost — and is that budget realistic? If nobody has asked this yet, ask it now.

A Pilot Should Surface Problems, Not Hide Them

The purpose of a pilot is to learn — not to impress. A good pilot deliberately surfaces the hard questions. Integration challenges. Organisational resistance. Data quality gaps. Alert fatigue. User adoption issues.

It brings those problems to the surface before they are expensive to fix.

A bad pilot hides those problems in the name of a smooth demo. And when the project tries to scale, every hidden problem becomes a visible barrier.

The organisations that successfully scale IoT are not the ones with the most impressive pilots. They are the ones who used their pilots to ask hard questions — and built the answers into their plan before committing serious budget.


Your IoT project does not have to become another cautionary story about pilots that never grew into deployments. But avoiding that outcome starts with one decision: design for scale from day one, not as an afterthought.

The path is clear. Connect your data. See what is really happening. Act on what you find.

That is how you move from a pilot that impressed everyone — to a deployment that helps everyone.

Ready to move from pilot to deployment?

Favoriot helps you connect your devices, see your operations in real time, and act on data — without building everything from scratch.

Explore Favoriot Book a Strategy Call
IoT Strategy AIoT Pilot Projects Scaling IoT Connect See Act Favoriot Digital Transformation

Copyright © 2026 All rights reserved