Posts in Internet of Things

Reducing Machine-Downtime Blindness With Favoriot

August 11th, 2026 Posted by BLOG, HOW-TO, Internet of Things, IOT PLATFORM, Operational Blindness 0 thoughts on “Reducing Machine-Downtime Blindness With Favoriot”

The Afternoon Everything Stopped

A production line goes quiet at 2:14 in the afternoon. Nobody on the floor knows why yet. The supervisor is walking the line asking the operator what happened. The operator is checking the panel. Someone has already called the maintenance contractor, just in case, because waiting to find out feels riskier than being wrong. Forty minutes pass before anyone has a real answer, and by then the shift’s output target is no longer realistic.

I have watched a version of this scene play out in more factories than I can count, and what strikes me every time is that it is rarely a story about broken equipment. It is a story about not knowing. The machine had already been signaling something was wrong. A vibration pattern had drifted. A motor had been running hotter than usual for three days. A pressure reading had crept past its normal range that same morning. The information existed. It just was not seen by anyone who could act on it in time.

That gap between having data and having sight is what I call downtime blindness, and it is a far more expensive problem than most operations teams realize.

What Downtime Blindness Actually Costs

The numbers are worth sitting with for a moment. Fluke’s 2025 downtime survey found that manufacturers are losing up to $852 million a week industry-wide to unplanned outages, with the average hour of downtime running around $1.7 million once lost production, idle labor, and recovery costs are added up. A few figures from that same survey stand out:

  • Frequency: Nearly half of manufacturers report six to ten downtime incidents every single week.
  • Duration: 45% of outages last up to twelve hours, and 15% stretch as long as seventy-two.
  • Prevalence: More than six in ten manufacturers experienced unplanned downtime in the past year.

These are not rare, catastrophic failures. They are a steady drip of small stoppages that quietly adds up to a very large number by the end of the quarter.

More Sensors Is Not the Same as More Sight

The instinct when a plant hears numbers like these is to reach for more sensors, and I understand the appeal. More data feels like more control. But I have seen plants add a dozen new sensors and still get caught off guard by the same kind of stoppage six months later, because the new readings simply landed in yet another dashboard nobody had time to check.

Adding instrumentation without adding a way to see across it does not close the blindness. It just makes the blind spot slightly better lit.

Most plants are not actually short on data to begin with. Walk into any mid-sized facility and you will typically find:

  1. PLCs logging cycle times and machine states.
  2. Sensors tracking temperature, vibration, and pressure.
  3. SCADA systems recording alarms as they happen.
  4. Maintenance software full of work orders nobody has time to read.

The instrumentation exists. What is usually missing is a connected view that turns all of that into something a supervisor can glance at and understand in five seconds, not five separate screens.

The Problem Sensors Cannot Fix: Retiring Expertise

There is a second layer to this problem that gets less attention than it deserves, and it has nothing to do with sensors at all. It is about people.

A recent industry analysis pointed out that a large share of manufacturing maintenance teams are watching their most experienced technicians retire, and that junior technicians can take three to three and a half times longer to diagnose the same fault. The instinct an experienced tech develops after twenty years, the ability to hear a bearing going bad before it shows up on any gauge, does not transfer automatically to the next generation. When that knowledge walks out the door, the plant does not just lose a person. It loses a diagnostic capability that took decades to build, and the blindness gets worse even though the sensors stay exactly the same.

So the real question is not whether a factory has enough data. It is whether that data has been connected into something the whole team can see and act on together, in a way that does not depend entirely on one person’s memory of what a strange noise usually means.

Connect, See, Act: Closing the Gap

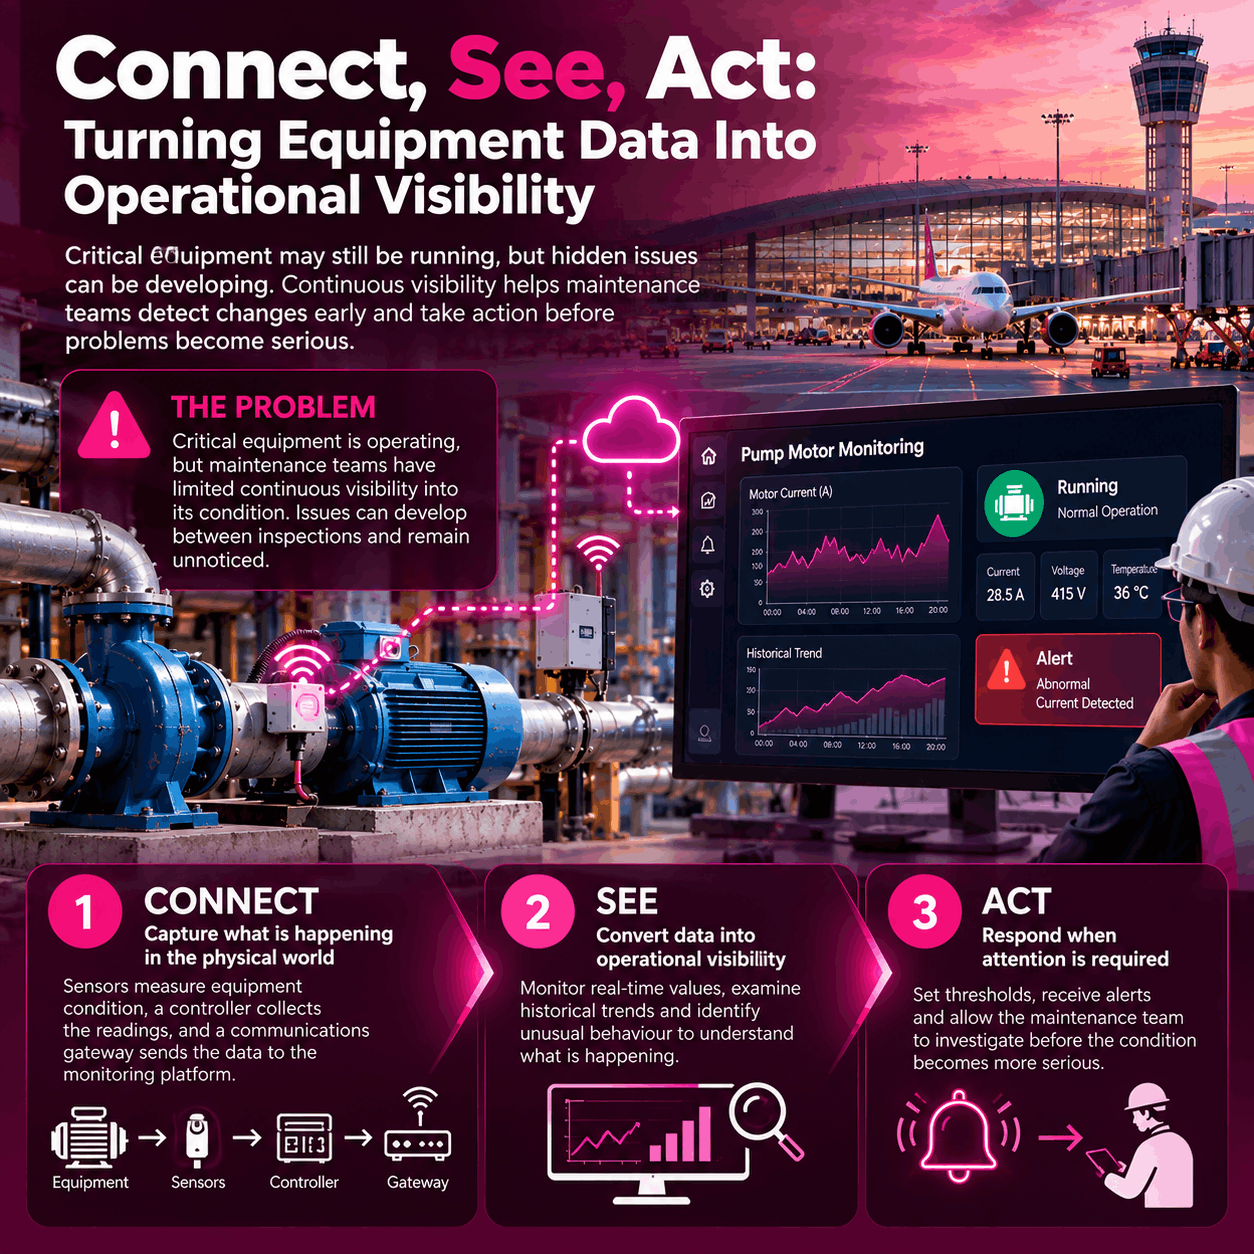
This is the exact gap we built Favoriot to close, and I want to be specific about how rather than just asserting it. Our approach follows a simple sequence.

Connect. Pull readings from machines, PLCs, and existing sensors into one place, regardless of whether that equipment is ten years old or ten weeks old. Most plants run a mix of both and cannot afford to rip out working hardware just to gain visibility.

See. Turn that raw stream into a live picture of asset health that a supervisor, a plant manager, and a maintenance planner can all look at and immediately understand, rather than three different systems each showing part of the truth.

Act. The platform does not stop at a chart. It flags the anomaly before it becomes a stoppage, routes it to the right person, and keeps a record of what happened so the next technician facing a similar pattern does not have to start from zero.

That last part matters more than it might sound. Every alert that gets resolved becomes a small piece of institutional memory. Over time, a plant using this kind of system is not just catching problems earlier, it is quietly building the same kind of pattern library that used to live only in a veteran technician’s head. That is a meaningful answer to the retirement problem above, and it has nothing to do with predicting the future perfectly. It is about making sure knowledge does not evaporate every time someone retires or moves on.

What Visibility Can and Cannot Do

I want to be honest that visibility alone will not fix every downtime problem. Some failures are mechanical and will happen regardless of how good your monitoring is. Some are caused by upstream supply issues that no sensor can see coming.

What a connected view does is shrink the forty minutes of confusion down to something closer to four, because the moment the line stops, someone already knows what changed, when it started drifting, and what the last three similar incidents looked like. That compression, from confusion to clarity, is where most of the real savings live. It is rarely about preventing every failure. It is about not being blind for the first half hour of one.

Three Questions Worth Asking Your Own Floor

If you are running operations and want a quick gut check on where your plant stands, ask yourself:

  1. When a machine stops, how long does it typically take before someone knows the root cause rather than just the symptom?
  2. If your most experienced technician left tomorrow, how much of their troubleshooting knowledge is actually written down anywhere your team can access?
  3. Do your current monitoring tools give you one connected picture, or are they five separate screens that nobody has time to check at once?

Most plants I talk to already know the answers, and the answers are usually not comfortable ones. That discomfort is a good sign, honestly, because it means the problem is visible enough to fix. I would rather have a plant manager tell me their monitoring is fragmented than have them tell me everything is fine, because the second answer usually means nobody has looked closely enough yet.

Start Small, Prove It Fast

The plants that make real progress on this rarely do it in one big overhaul. They usually start with the single line or the single asset class that causes them the most grief, connect it properly, and let the team get comfortable with what a clear picture actually feels like before expanding further.

That approach also tends to build internal trust faster, because operators and technicians can see the tool catching something real in week one rather than waiting months for a plant-wide rollout to prove itself.

If any of this sounds familiar and you want to see what a Connect, See, Act view of your own floor could look like, we are always happy to walk through it with you. No pressure, just a conversation about where your blind spots actually are.

How to Build an Operational Visibility Gap Map

August 7th, 2026 Posted by BLOG, Internet of Things, IOT PLATFORM, Operational Blindness 0 thoughts on “How to Build an Operational Visibility Gap Map”

Most organizations are not short on data. Sensors, dashboards, and reports generate more operational information than ever before. Yet many still get surprised: a pump fails without warning, a shipment is delayed and nobody notices until the customer calls, a compliance issue only surfaces during an audit.

This gap, between what an organization knows and what its operations actually need it to know, is called the Visibility Gap. It is rarely caused by a lack of information. It is caused by an inability to turn that information into shared awareness, timely decisions, and coordinated action.

An Operational Visibility Gap Map is the tool that makes this gap visible and fixable. It turns “something is not working” into a clear picture of where visibility breaks down across people, process, data, and systems. Below is a simple, step by step way to build one.

1. Start with the decision, not the data

The most common mistake is starting with a list of sensors or dashboards instead of starting with a decision. Begin by naming the critical operational decision that visibility is meant to support. Some examples:

  • When should a machine be stopped before it fails?
  • Which remote tank needs urgent refilling?
  • Which flood site needs immediate inspection?
  • Which maintenance task should be prioritized this week?

Naming the decision first gives the exercise discipline. Skip this step and teams usually end up with a scattered list of complaints and a roadmap nobody owns.

2. Trace the operational flow

Once the critical decision is clear, trace the chain that leads to it:

  1. Asset
  2. Event
  3. Data capture
  4. Transmission
  5. Storage
  6. Dashboard
  7. Alert
  8. Owner
  9. Decision
  10. Action
  11. Review

Walking through this chain stage by stage, instead of jumping straight to a technology fix, matters because a missing sensor is a different problem from an alert nobody is assigned to receive. Treating them the same way leads to the wrong investment.

3. Score each stage honestly

For every stage, rate it as strong, partial, weak, or missing, and write down the consequence in plain language. A few examples of what this looks like in practice:

  • The asset is fully monitored, but the alert it generates has no assigned owner. That is data without action.
  • Data reaches the dashboard reliably, but the dashboard only shows averages instead of exceptions. That is visibility without real decision support.
  • Reports exist, but they arrive a day after the event. That is information without usefulness.

These distinctions matter because each one points to a different fix: some are ownership problems, some are workflow problems, some are design problems.

4. Back every finding with evidence

A gap map built purely on opinion is easy to dismiss in a management meeting. Strengthen each finding with something concrete, such as alarm logs, downtime records, maintenance tickets, incident reports, customer complaints, or site photos.

It helps to grade evidence into three levels:

  • Direct evidence: system logs, measurements, documented records.
  • Observed evidence: site visits, process reviews, screenshots.
  • Interview evidence: stakeholder statements.

When all three point to the same conclusion, confidence is high. When only interviews support a finding, say so plainly and flag it as needing further validation.

5. Turn findings into a matrix

Once the flow has been walked and rated, organize everything into a matrix rather than a loose list. A practical version uses six columns:

  1. Blind spot: what is not visible enough.
  2. Evidence: proof that it exists.
  3. Affected decision: what becomes weak because of it.
  4. Business impact: cost, delay, risk, safety, or compliance exposure.
  5. Owner: who is responsible for the area.
  6. Possible action: what would close the gap.

This is what makes a gap map usable instead of just descriptive. Compare these two statements:

“Visibility is weak in maintenance.”

“Vibration data exists but has no threshold rule, which delays the stop-machine decision by about six hours, costing an estimated RM40,000 per incident, owned by the plant manager, and fixable by adding an alert rule and an escalation path.”

Only the second one gives a leadership team something to act on.

6. Score overall maturity, not just individual gaps

Alongside the specific findings, it helps to score the organization across a few dimensions, such as:

  • Asset visibility
  • Process visibility
  • Data freshness
  • Decision velocity
  • Actionability
  • Cross-team coordination
  • Accountability

Weakness in any one dimension pulls down the value of the others. An organization can have excellent sensor coverage and still be operationally blind if nobody has clear responsibility for acting on what those sensors report. The score is not a scoreboard for blame. It gives everyone a factual basis for deciding where to invest next, instead of an argument based on impressions.

7. Prioritize by impact, not by ease

With the matrix complete, resist the urge to fix whatever is cheapest first. Filter every finding through five questions:

  1. Does this blind spot affect a high-value decision?
  2. Does it create measurable cost, risk, delay, safety, or compliance exposure?
  3. Can the needed data realistically be captured within reasonable effort?
  4. Is there an owner who will actually act on the information once it exists?
  5. Can success be measured within roughly ninety to a hundred and eighty days?

The best first project is rarely the largest one on the list. It is the one that proves the value of visibility quickly and credibly, because that early win earns trust for the next phase of investment.

8. Let the map drive what gets built next

A gap map is not a report that gets filed away after a workshop. It should shape whatever gets built next:

  • If the gap is asset condition, focus on sensor coverage and device reliability.
  • If the gap is delayed response, focus on alerting, escalation paths, and ownership.
  • If the gap is fragmented reporting, focus on data consolidation and shared dashboards.
  • If the gap is weak AI readiness, focus on data quality, historical storage, and governance before attempting any predictive model.

Every component that eventually gets built should trace back to a specific blind spot on the map. That discipline is what stops a visibility initiative from becoming a collection of impressive features that never close the gap they were meant to close.

9. Keep it a living document

Operations change. Assets get added, teams reorganize, and a stage that was strong six months ago can quietly become weak again. Revisit the map on a regular cycle rather than treating it as a one time exercise. Organizations that keep their gap map current are the ones that move steadily from operationally blind toward operationally visible, and eventually toward operations run on operational truth instead of assumption.

How to Run an Operational Blindness Assessment

How to Run an Operational Blindness Assessment

August 4th, 2026 Posted by BLOG, HOW-TO, Internet of Things, Operational Blindness 0 thoughts on “How to Run an Operational Blindness Assessment”

A Practical Framework for Identifying Hidden Operational Risks Before They Become Business Problems

Many organisations believe they have good visibility because they have invested in IoT devices, enterprise software, dashboards, and Artificial Intelligence. Control rooms are filled with screens, operational reports arrive daily, and key performance indicators appear healthy.

Yet equipment still fails unexpectedly. Service interruptions continue to occur. Response times remain slow. Decisions are delayed, and different departments often work with conflicting information.

These situations reveal a fundamental problem. The organisation is connected, but it is not truly visible.

Operational Blindness is the inability to detect, understand, coordinate, and respond to operational events quickly enough to maintain safe, efficient, and resilient operations. It is not simply a technology issue. It is a visibility issue.

An Operational Blindness Assessment (OBA) provides a systematic way to identify where these blind spots exist, measure their impact, and develop a roadmap for improving operational visibility.

Rather than asking, “Do we have enough technology?”, an Operational Blindness Assessment asks a far more valuable question:

“Can our organisation consistently see what is happening across its operations and respond before small issues become major problems?”

Why Every Organisation Needs an Operational Blindness Assessment

Operational Blindness develops gradually. Manual workarounds become accepted practices. Delayed reporting becomes normal. Teams rely on phone calls, emails, spreadsheets, or messaging groups to coordinate responses. Over time, these practices create hidden risks that are rarely visible until an incident occurs.

An Operational Blindness Assessment uncovers these weaknesses before they affect operational performance.

The assessment helps organisations:

  • Identify invisible operational risks
  • Measure decision delays
  • Discover data and process gaps
  • Evaluate cross-functional coordination
  • Prioritise investments that improve operational visibility
  • Establish a baseline for continuous improvement

Instead of focusing only on technology, the assessment evaluates how effectively the organisation converts operational data into timely action.

Step 1: Identify Critical Operations

The first step is determining which operations are essential to business continuity.

Every organisation has processes where failure carries significant operational, financial, regulatory, or safety consequences.

Examples include:

IndustryCritical Operations
Water UtilitiesPump stations, reservoirs, pressure zones, water quality
ManufacturingProduction lines, critical machines, utilities
Smart BuildingsHVAC systems, lifts, energy management, indoor air quality
HealthcareCold-chain storage, medical gases, backup power
EnergySubstations, transformers, renewable energy assets
Smart CitiesFlood monitoring, traffic control, street lighting, waste collection

These operations should become the primary focus of the assessment because improving visibility in these areas delivers the greatest operational value.

Step 2: Map the Operational Workflow

Technology diagrams rarely reflect how work actually gets done.

Instead, map the real operational workflow from the moment an event occurs until corrective action is completed.

A typical workflow includes:

For each stage, ask:

  • How is the event detected?
  • Who receives the information?
  • Is the information available immediately or after manual reporting?
  • Who has authority to make decisions?
  • How long does each stage take?
  • What happens if the responsible person is unavailable?

Many organisations discover that their largest delays occur not because of missing technology, but because of inefficient operational processes.

Step 3: Locate Operational Blind Spots

Once workflows have been mapped, the next task is identifying where visibility is lost.

Common blind spots include:

Invisible Assets

Critical equipment operates without continuous monitoring, making failures difficult to detect until someone notices them manually.

Fragmented Information

Operational data is scattered across multiple systems that cannot communicate with one another.

Delayed Operational Reporting

Important information reaches decision makers long after the event has occurred.

Manual Communication

Operational coordination depends on phone calls, WhatsApp groups, spreadsheets, or paper records.

Lack of Operational Context

Data is available, but operators cannot easily determine whether conditions are normal or abnormal.

Unclear Ownership

No individual or team is responsible for monitoring specific operational conditions or responding when problems arise.

Each blind spot represents an opportunity to improve operational visibility.

Step 4: Evaluate the Five Layers of Operational Blindness

An effective assessment should examine operational visibility across five interconnected layers.

1. Data Blindness

Determine whether operational data is complete, accurate, and continuously available.

Questions include:

  • Are all critical assets connected?
  • Can missing or incorrect data be detected?
  • Is operational data trusted by decision makers?

2. Context Blindness

Data alone is insufficient if people cannot interpret its meaning.

Assess whether operators understand:

  • What normal operations look like
  • Which conditions require attention
  • How different operational events are related

Dashboards displaying numbers without operational context often create a false sense of confidence.

3. Decision Blindness

Evaluate how quickly operational decisions are made after an event is detected.

Look for indicators such as:

  • Multiple approval layers
  • Delayed escalation
  • Uncertainty about responsibility
  • Decisions based on assumptions rather than evidence

The longer the decision process, the greater the operational risk.

4. Coordination Blindness

Even when departments have access to the same information, poor coordination can delay action.

Assess whether:

  • Teams share the same operational picture.
  • Operational responsibilities are clearly defined.
  • Information flows efficiently between departments.
  • Responses are coordinated rather than duplicated.

Operational visibility is as much about collaboration as it is about technology.

5. Learning Blindness

The final layer examines whether the organisation learns from operational incidents.

Questions include:

  • Are incidents investigated systematically?
  • Are root causes documented?
  • Are operational procedures updated?
  • Are lessons shared across teams?

If similar incidents continue to occur, the organisation may be suffering from Learning Blindness.

Step 5: Measure the Decision Window

One of the most revealing parts of an Operational Blindness Assessment is measuring the Decision Window.

This is the time required to move from an operational event to a verified response.

A typical timeline is:

Instead of estimating, measure the elapsed time at every stage.

For example:

StageTime
Event detection2 minutes
Investigation15 minutes
Decision approval30 minutes
Response execution20 minutes
Verification10 minutes

Total Decision Window: 77 minutes

The next question is equally important:

Could this process have been completed in 10 or 15 minutes if better operational visibility existed?

The difference represents the cost of Operational Blindness.

Step 6: Calculate an Operational Blindness Index

The assessment findings can be converted into an Operational Blindness Index (OBI) that provides a measurable benchmark for improvement.

Typical assessment categories include:

  • Visibility of critical assets
  • Data quality and reliability
  • Operational context
  • Decision speed
  • Cross-functional coordination
  • Incident response
  • Continuous learning
  • Automation readiness

Each category can be scored using a five-point maturity scale.

An overall OBI score allows organisations to benchmark progress over time and compare operational maturity across different sites or departments.

Step 7: Build a Visibility Improvement Roadmap

The assessment should conclude with a practical action plan.

Rather than attempting to solve every issue simultaneously, prioritise improvements that deliver immediate operational value.

Typical recommendations include:

  1. Connect previously unmonitored critical assets.
  2. Replace manual reporting with automated data collection.
  3. Consolidate fragmented operational information into a unified view.
  4. Introduce real-time alerts for abnormal operating conditions.
  5. Clarify operational ownership and escalation procedures.
  6. Automate repetitive workflows where appropriate.
  7. Review operational incidents regularly and update response procedures.

Incremental improvements often produce significant gains in operational performance.

From Assessment to Operational Visibility

An Operational Blindness Assessment identifies where visibility is missing. The next step is addressing those gaps through an Operational Visibility Platform (OVP).

An OVP goes beyond collecting IoT data. It continuously connects assets, validates operational information, provides context, detects abnormal conditions, coordinates responses, and supports evidence-based decision making.

In simple terms, it helps organisations move from connected operations to visible operations, enabling faster decisions, stronger coordination, and greater operational resilience.

Seeing Clearly Is the First Step Toward Better Operations

Operational Blindness is not an abstract concept. It can be measured, analysed, and systematically reduced.

An Operational Blindness Assessment gives organisations a clear understanding of where they lack visibility, why operational decisions are delayed, and which improvements will have the greatest impact. It shifts the conversation away from buying more technology and toward building operational awareness.

As organisations continue investing in AI, automation, and connected infrastructure, the greatest competitive advantage will belong to those that can see their operations clearly, understand what those operations are telling them, and act before minor issues become major disruptions.

The journey towards Operational Visibility begins with a simple question:

“Where are we still operationally blind?”

Copyright © 2026 All rights reserved