Posts in IOT PLATFORM

How to Build an Operational Visibility Gap Map

August 7th, 2026 Posted by BLOG, Internet of Things, IOT PLATFORM, Operational Blindness 0 thoughts on “How to Build an Operational Visibility Gap Map”

Most organizations are not short on data. Sensors, dashboards, and reports generate more operational information than ever before. Yet many still get surprised: a pump fails without warning, a shipment is delayed and nobody notices until the customer calls, a compliance issue only surfaces during an audit.

This gap, between what an organization knows and what its operations actually need it to know, is called the Visibility Gap. It is rarely caused by a lack of information. It is caused by an inability to turn that information into shared awareness, timely decisions, and coordinated action.

An Operational Visibility Gap Map is the tool that makes this gap visible and fixable. It turns “something is not working” into a clear picture of where visibility breaks down across people, process, data, and systems. Below is a simple, step by step way to build one.

1. Start with the decision, not the data

The most common mistake is starting with a list of sensors or dashboards instead of starting with a decision. Begin by naming the critical operational decision that visibility is meant to support. Some examples:

  • When should a machine be stopped before it fails?
  • Which remote tank needs urgent refilling?
  • Which flood site needs immediate inspection?
  • Which maintenance task should be prioritized this week?

Naming the decision first gives the exercise discipline. Skip this step and teams usually end up with a scattered list of complaints and a roadmap nobody owns.

2. Trace the operational flow

Once the critical decision is clear, trace the chain that leads to it:

  1. Asset
  2. Event
  3. Data capture
  4. Transmission
  5. Storage
  6. Dashboard
  7. Alert
  8. Owner
  9. Decision
  10. Action
  11. Review

Walking through this chain stage by stage, instead of jumping straight to a technology fix, matters because a missing sensor is a different problem from an alert nobody is assigned to receive. Treating them the same way leads to the wrong investment.

3. Score each stage honestly

For every stage, rate it as strong, partial, weak, or missing, and write down the consequence in plain language. A few examples of what this looks like in practice:

  • The asset is fully monitored, but the alert it generates has no assigned owner. That is data without action.
  • Data reaches the dashboard reliably, but the dashboard only shows averages instead of exceptions. That is visibility without real decision support.
  • Reports exist, but they arrive a day after the event. That is information without usefulness.

These distinctions matter because each one points to a different fix: some are ownership problems, some are workflow problems, some are design problems.

4. Back every finding with evidence

A gap map built purely on opinion is easy to dismiss in a management meeting. Strengthen each finding with something concrete, such as alarm logs, downtime records, maintenance tickets, incident reports, customer complaints, or site photos.

It helps to grade evidence into three levels:

  • Direct evidence: system logs, measurements, documented records.
  • Observed evidence: site visits, process reviews, screenshots.
  • Interview evidence: stakeholder statements.

When all three point to the same conclusion, confidence is high. When only interviews support a finding, say so plainly and flag it as needing further validation.

5. Turn findings into a matrix

Once the flow has been walked and rated, organize everything into a matrix rather than a loose list. A practical version uses six columns:

  1. Blind spot: what is not visible enough.
  2. Evidence: proof that it exists.
  3. Affected decision: what becomes weak because of it.
  4. Business impact: cost, delay, risk, safety, or compliance exposure.
  5. Owner: who is responsible for the area.
  6. Possible action: what would close the gap.

This is what makes a gap map usable instead of just descriptive. Compare these two statements:

“Visibility is weak in maintenance.”

“Vibration data exists but has no threshold rule, which delays the stop-machine decision by about six hours, costing an estimated RM40,000 per incident, owned by the plant manager, and fixable by adding an alert rule and an escalation path.”

Only the second one gives a leadership team something to act on.

6. Score overall maturity, not just individual gaps

Alongside the specific findings, it helps to score the organization across a few dimensions, such as:

  • Asset visibility
  • Process visibility
  • Data freshness
  • Decision velocity
  • Actionability
  • Cross-team coordination
  • Accountability

Weakness in any one dimension pulls down the value of the others. An organization can have excellent sensor coverage and still be operationally blind if nobody has clear responsibility for acting on what those sensors report. The score is not a scoreboard for blame. It gives everyone a factual basis for deciding where to invest next, instead of an argument based on impressions.

7. Prioritize by impact, not by ease

With the matrix complete, resist the urge to fix whatever is cheapest first. Filter every finding through five questions:

  1. Does this blind spot affect a high-value decision?
  2. Does it create measurable cost, risk, delay, safety, or compliance exposure?
  3. Can the needed data realistically be captured within reasonable effort?
  4. Is there an owner who will actually act on the information once it exists?
  5. Can success be measured within roughly ninety to a hundred and eighty days?

The best first project is rarely the largest one on the list. It is the one that proves the value of visibility quickly and credibly, because that early win earns trust for the next phase of investment.

8. Let the map drive what gets built next

A gap map is not a report that gets filed away after a workshop. It should shape whatever gets built next:

  • If the gap is asset condition, focus on sensor coverage and device reliability.
  • If the gap is delayed response, focus on alerting, escalation paths, and ownership.
  • If the gap is fragmented reporting, focus on data consolidation and shared dashboards.
  • If the gap is weak AI readiness, focus on data quality, historical storage, and governance before attempting any predictive model.

Every component that eventually gets built should trace back to a specific blind spot on the map. That discipline is what stops a visibility initiative from becoming a collection of impressive features that never close the gap they were meant to close.

9. Keep it a living document

Operations change. Assets get added, teams reorganize, and a stage that was strong six months ago can quietly become weak again. Revisit the map on a regular cycle rather than treating it as a one time exercise. Organizations that keep their gap map current are the ones that move steadily from operationally blind toward operationally visible, and eventually toward operations run on operational truth instead of assumption.
How Favoriot Reduces Operational Blindness Through Connect, See and Act

How Favoriot Reduces Operational Blindness Through Connect, See and Act

August 3rd, 2026 Posted by BLOG, HOW-TO, Internet of Things, IOT PLATFORM, Operational Blindness 2 thoughts on “How Favoriot Reduces Operational Blindness Through Connect, See and Act”

Many organizations invest heavily in IoT sensors, cloud platforms, and dashboards, yet still struggle with delayed responses, equipment failures, rising costs, and operational inefficiencies. The issue is often not a lack of data but a lack of operational visibility.

This is known as Operational Blindness, where organizations collect vast amounts of operational data but cannot turn it into timely decisions and effective actions.

Favoriot addresses this challenge through a simple yet powerful framework:

Connect

Operational visibility begins with connecting assets, devices, and systems. Favoriot securely gathers data from sensors, machines, meters, SCADA systems, and other operational technologies using open communication standards.

More importantly, it transforms fragmented information into trusted operational data, providing a reliable foundation for decision-making.

Without trusted data, organizations simply automate uncertainty.

See

Collecting data is only the first step. Dashboards may display numbers, but they rarely explain what those numbers mean.

Favoriot converts operational data into operational visibility by adding context, trends, alerts, asset information, and location intelligence. Instead of forcing users to search through thousands of readings, the platform highlights abnormal conditions, identifies operational risks, and helps decision makers understand what requires immediate attention.

The goal is not to display more data but to make operations visible.

Act

Visibility creates value only when it leads to action.

Favoriot enables organizations to respond quickly through automated alerts, notifications, workflow integration, and operational tracking. Teams know what happened, where it happened, who should respond, and whether corrective action has been completed.

This closes the gap between monitoring and execution, reducing delays and improving accountability.

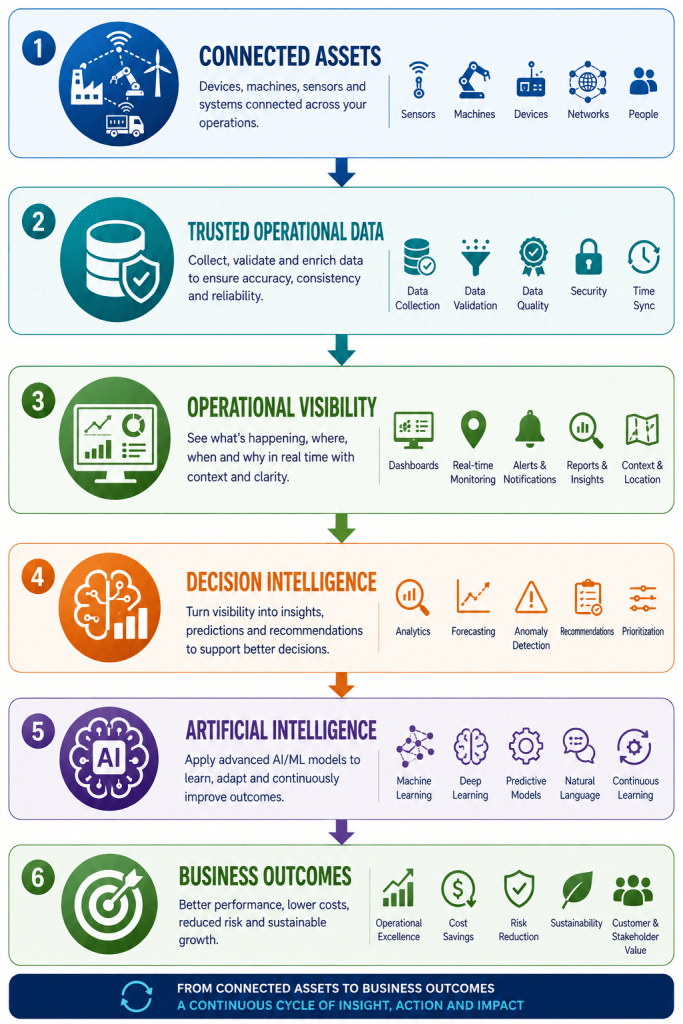
From Connected Assets to Business Outcomes

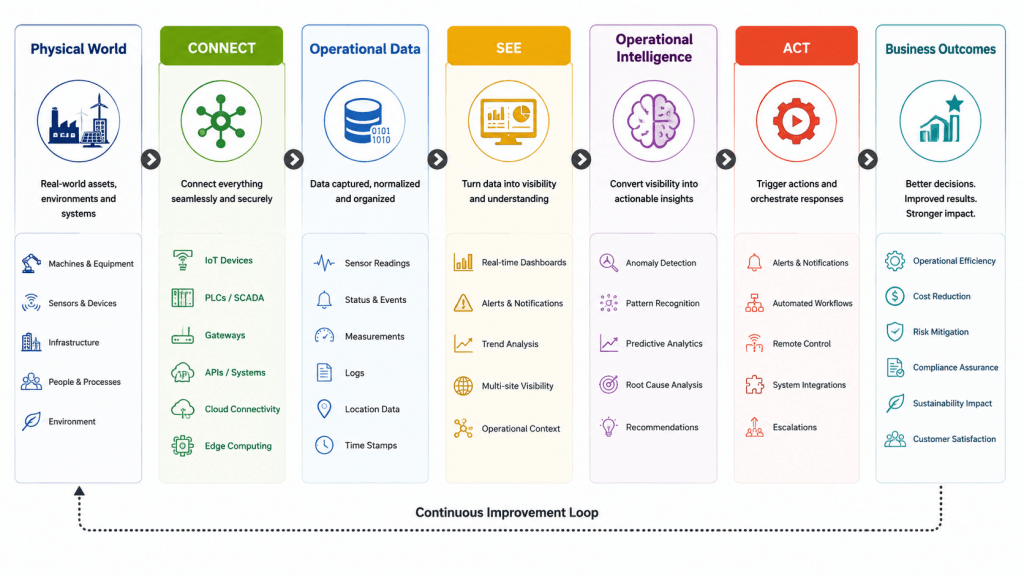
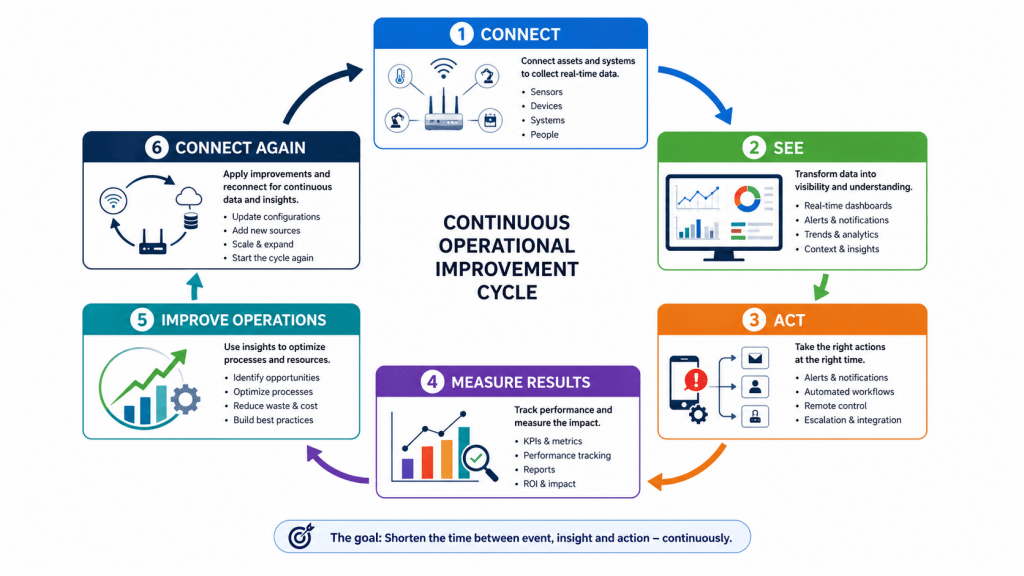
Favoriot’s approach follows a continuous operational improvement cycle:

Each action generates new operational knowledge, helping organizations improve future decisions and continuously reduce Operational Blindness.

Applicable Across Every Industry

The Connect • See • Act framework applies across many sectors, including:

  • Smart Buildings
  • Water Utilities
  • Manufacturing
  • Smart Cities
  • Energy Management
  • Cold Chain Logistics
  • Agriculture
  • Environmental Monitoring

Regardless of the industry, the objective remains the same: transform disconnected operational data into coordinated operational decisions.

Beyond an IoT Platform

Traditional IoT platforms focus on connecting devices and displaying dashboards. Favoriot goes a step further by helping organizations answer the questions that matter most:

  • What is happening?
  • Why is it happening?
  • Where is it happening?
  • Who should respond?
  • Has the issue been resolved?

These answers create operational visibility, which is essential before organizations can fully benefit from AI and autonomous operations.

Conclusion

Technology alone does not eliminate Operational Blindness. Organizations must first connect their operations, gain clear visibility into what is happening, and ensure every important event leads to the right action.

This is why Favoriot is evolving beyond a conventional AIoT platform into an Operational Visibility Platform (OVP). Guided by the Connect • See • Act framework, it enables organizations to move beyond collecting data and begin making faster, smarter, and more confident operational decisions.

How Favoriot Reduces Operational Blindness Through Connect, See and Act™

July 31st, 2026 Posted by BLOG, Internet of Things, IOT PLATFORM, Operational Blindness 0 thoughts on “How Favoriot Reduces Operational Blindness Through Connect, See and Act™”

By Dr. Mazlan Abbas

Introduction

Many organizations believe they have become digital because they have deployed sensors, installed dashboards, and connected their assets to the cloud. Yet despite these investments, they continue to experience equipment failures, energy waste, compliance issues, delayed responses, and costly operational disruptions.

The problem is not the absence of technology.

The problem is Operational Blindness.

Operational Blindness occurs when an organization cannot observe, understand, or respond to what is happening across its operations quickly enough to make effective decisions. Data may exist, but it arrives too late, lacks context, remains trapped in silos, or never reaches the people who must act.

This is why Favoriot introduces a different way of thinking.

Instead of asking, “How many devices are connected?”, organizations should ask:

“Can we detect problems early enough to prevent operational losses?”

The answer lies in Favoriot’s Connect, See and Act™ framework.

This framework transforms disconnected operational data into timely actions that improve business outcomes.

The Cost of Operational Blindness

Operational Blindness affects every industry.

A factory may only discover machine degradation after production quality has dropped.

A water utility may only learn about pipeline leaks after thousands of liters have been lost.

A smart building may continue consuming excessive energy because nobody notices abnormal HVAC behavior.

A museum may discover unstable humidity only after valuable artifacts have deteriorated.

In every case, the physical problem began much earlier than the organization’s response.

The gap between the occurrence of a problem and the action taken is where Operational Blindness exists.

Reducing that gap is far more valuable than simply collecting more data.

The Connect, See and Act™ Philosophy

Favoriot approaches Operational Visibility as a continuous operational cycle.

Instead of ending at dashboards, Favoriot helps organizations move from connected assets to operational decisions and measurable action.

Each stage serves a specific purpose.

CONNECT

Turning Physical Operations into Trusted Data

Nothing can be improved unless it can first be observed.

The Connect layer focuses on acquiring trusted operational data from the physical world.

Favoriot connects to numerous operational assets, including:

  • IoT sensors
  • PLCs
  • SCADA systems
  • Modbus devices
  • OPC-UA servers
  • Smart meters
  • Environmental monitoring systems
  • GPS trackers
  • Existing enterprise applications
  • REST APIs
  • MQTT brokers
  • Legacy systems through gateways

Rather than replacing existing infrastructure, Favoriot extends it by bringing data into a unified operational environment.

Typical connected information includes:

  • Temperature
  • Humidity
  • Pressure
  • Machine vibration
  • Energy consumption
  • Water flow
  • Tank levels
  • Equipment status
  • Environmental quality
  • Asset location

The objective is not merely data collection.

It is collecting the right operational data continuously and reliably.

SEE

Converting Data into Operational Visibility

Connected data alone does not solve Operational Blindness.

Many organizations already possess thousands of data points but still fail to understand what is happening.

The See layer converts operational data into operational understanding.

Favoriot provides:

Real-Time Dashboards

Different stakeholders receive dashboards designed for their operational responsibilities rather than generic reports.

Alerts

Users receive immediate notifications whenever thresholds are exceeded.

Examples include:

  • Water leakage
  • Machine overheating
  • Energy spikes
  • Unauthorized access
  • Low battery levels
  • High vibration
  • Air quality deterioration

Trend Analysis

Instead of reacting only to current events, organizations begin identifying patterns before failures occur.

Multi-Site Visibility

Operations across multiple factories, campuses, buildings, or cities can be monitored through a single platform.

Operational Context

Different data streams are correlated to reveal the true operational situation.

For example:

High energy consumption may not be caused by electricity usage alone.

It may coincide with:

  • HVAC malfunction
  • Outdoor temperature
  • Occupancy level
  • Equipment operating schedule

Context transforms isolated numbers into operational insight.

ACT

Closing the Decision Loop

Many digital systems stop after visualization.

Favoriot continues further.

Operational visibility becomes valuable only when it leads to action.

The Act layer enables organizations to respond immediately through:

Automated Notifications

Alerts can be delivered through:

  • Email
  • SMS
  • Telegram
  • Webhooks
  • Enterprise applications

Workflow Integration

Incidents can automatically trigger:

  • Maintenance requests
  • Service tickets
  • Inspection workflows
  • Escalation procedures

Remote Commands

Authorized users may remotely control supported devices, including:

  • Pumps
  • Valves
  • Lighting
  • HVAC systems
  • Smart switches

AI-Assisted Decision Support

Historical operational data becomes the foundation for predictive analytics and AI models.

Instead of asking,

“What happened yesterday?”

organizations begin asking,

“What is likely to happen next?”

This shifts operations from reactive management toward predictive decision-making.

The Continuous Operational Loop

Unlike traditional monitoring systems, Favoriot creates a continuous operational feedback cycle.

Each completed cycle improves operational knowledge.

Over time, organizations become progressively less blind and increasingly proactive.

Practical Example

Smart Building

Without Favoriot:

An air-conditioning unit gradually loses efficiency.

Energy bills increase.

Occupants complain.

Maintenance investigates several weeks later.

Repairs become expensive.

With Favoriot:

Sensors continuously monitor:

  • Temperature
  • Energy consumption
  • Vibration
  • Indoor air quality

Favoriot detects abnormal energy usage.

Maintenance receives an immediate alert.

The issue is inspected before occupants notice any problem.

Energy waste is minimized.

Equipment life is extended.

Operational Blindness has been reduced.

Practical Example

Water Utility

Without Favoriot:

A leaking pipeline remains undetected overnight.

Thousands of liters of treated water are lost.

Customers report low water pressure.

Repair begins after significant financial loss.

With Favoriot:

Pressure and flow sensors continuously report operational conditions.

Unexpected flow imbalance triggers alerts.

Maintenance teams receive immediate notifications.

Repairs begin much earlier.

Water losses are significantly reduced.

Practical Example

ESG Reporting

Many organizations still prepare ESG reports using spreadsheets and manual data collection.

This often results in:

  • Missing records
  • Delayed reporting
  • Inconsistent evidence
  • Audit challenges

Favoriot continuously captures environmental and operational data directly from connected assets.

Carbon emissions, energy consumption, water usage, waste metrics, and environmental conditions are automatically recorded with timestamps.

Organizations gain evidence-based ESG reporting supported by trusted operational data instead of manual estimates.

Why Connect, See and Act™ Is Different

Many IoT platforms primarily focus on device connectivity.

Others specialize in dashboards.

Some concentrate on analytics.

Favoriot combines all three operational capabilities into a single continuous framework.

Instead of stopping at visualization, Favoriot helps organizations shorten the distance between:

  • Event and detection
  • Detection and understanding
  • Understanding and decision
  • Decision and action

That shortened decision window is what reduces Operational Blindness.

From AIoT Platform to Operational Visibility Platform

As organizations mature, they require more than connectivity.

They need operational visibility.

Favoriot has evolved beyond being an IoT platform into an Operational Visibility Platform (OVP).

Its purpose is not merely to collect operational data.

Its purpose is to help organizations:

  • Connect operational assets
  • See operational reality
  • Act before small problems become major incidents

This approach supports sectors including:

  • Manufacturing
  • Smart buildings
  • Energy
  • Water utilities
  • Renewable energy
  • Environmental monitoring
  • Healthcare
  • Agriculture
  • Logistics
  • Smart cities
  • Critical infrastructure

Across these sectors, the common objective remains the same:

Reduce Operational Blindness.

Conclusion

Digital transformation is no longer measured by the number of connected devices.

It is measured by how quickly organizations can recognize problems, understand their impact, and take the right action.

Favoriot’s Connect, See and Act™ framework provides the missing operational link between data collection and business outcomes.

By continuously connecting assets, providing operational visibility, and enabling timely action, organizations can reduce blind spots, improve decision speed, lower operational costs, and build a more resilient enterprise.

Technology alone does not eliminate Operational Blindness.

The ability to connect the right data, see the right insights, and act at the right time does.

Copyright © 2026 All rights reserved