Posts in Favoriot Insight Framework

How Energy Data Becomes Trusted Decisions

How Energy Data Becomes Trusted Decisions Using Favoriot

May 28th, 2026 Posted by BLOG, Favoriot Insight Framework, HOW-TO, Internet of Things, IOT PLATFORM 0 thoughts on “How Energy Data Becomes Trusted Decisions Using Favoriot”
Smart Energy Management Using the Favoriot Insight Framework
Project Challenge #5 · Smart Energy Management

How Energy Data Becomes Trusted Decisions

Smart Energy Management is not only about meters, dashboards, and monthly bills. It begins with clear intent, trusted data, meaningful insights, and timely action.

From Intent to Action

Smart buildings need more than energy visibility

Many organisations can see energy consumption, but fewer can explain why waste happens, what risks are coming, and which actions should be taken next.

Designed with purpose before technology

Smart Energy Management must start by asking a simple question: why is energy data being collected?

The Favoriot Insight Framework helps organisations move from raw telemetry to practical decisions for cost control, asset care, ESG reporting, and operational governance.

The result is a building that is not merely monitored, but understood.

Smart Energy Management must be designed with intent before technology.

The right question comes before the right sensor.

Favoriot Insight Framework

The 6-layer path from energy data to action

The original article used Layer 0 to Layer 5. This webpage renumbers them as Layer 1 to Layer 6.

1

Intent and Context

Why is energy data being collected?
  • Define the real energy management problem.
  • Set what normal consumption means for the building.
  • Identify risks such as peak demand penalties, carbon exposure, or equipment failure.
  • Decide what actions should happen when anomalies appear.
2

Data Foundation

Capture reality.
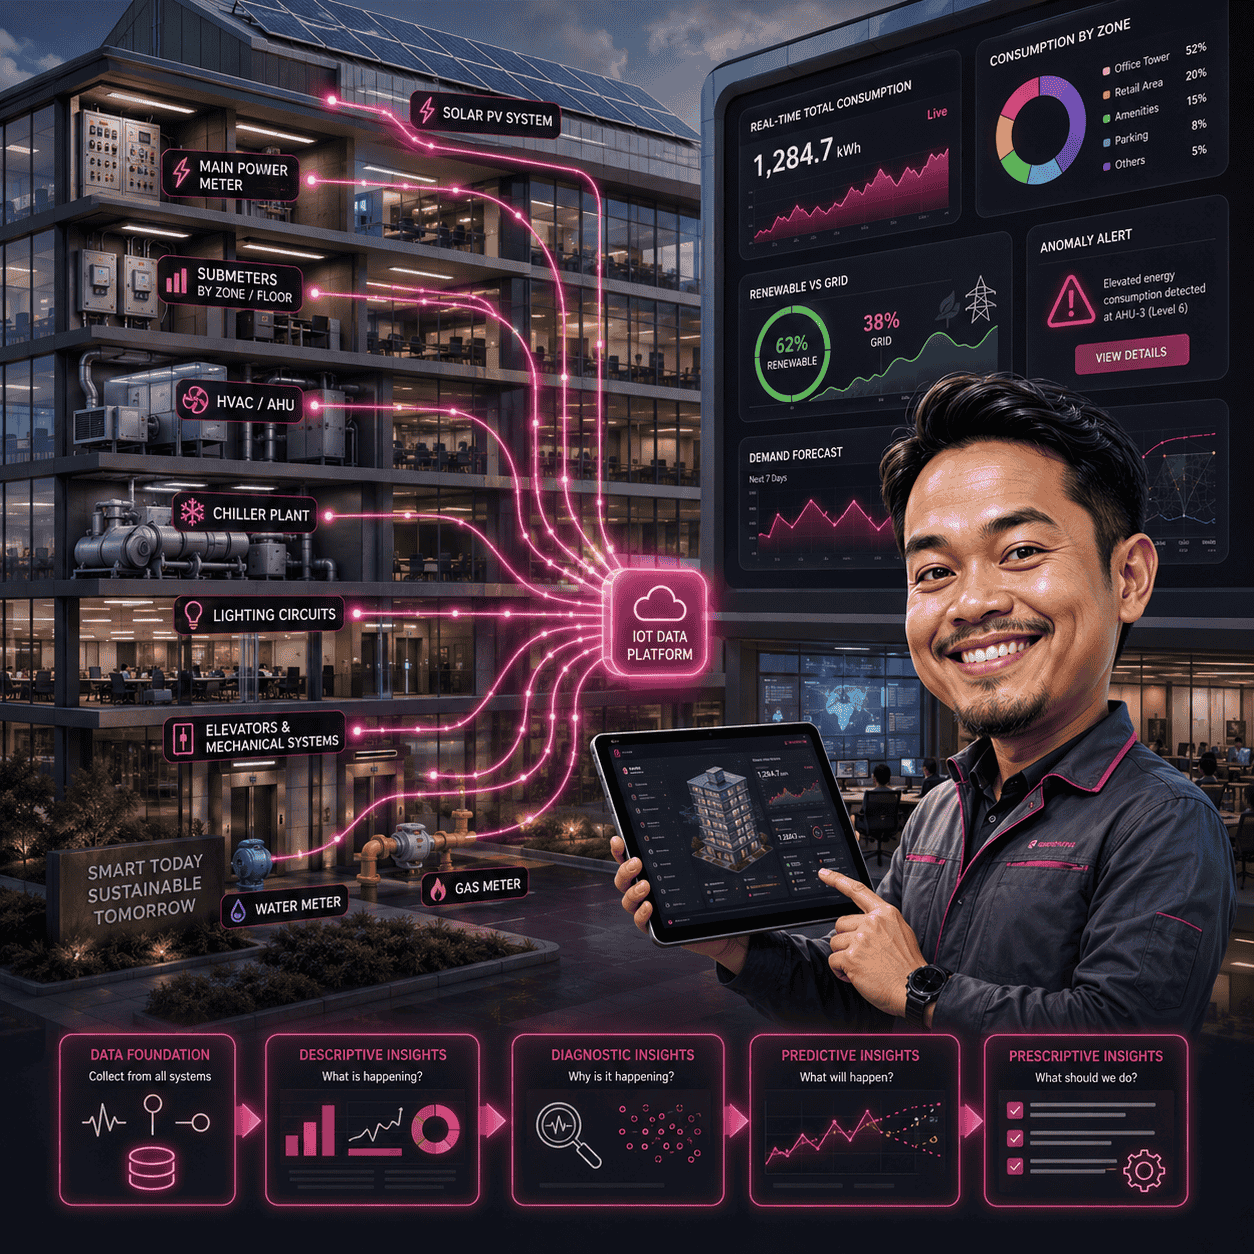
  • Collect data from main meters and submeters.
  • Monitor HVAC, chillers, lighting, elevators, and mechanical systems.
  • Include solar generation, water, and gas readings where needed.
  • Send trusted telemetry into Favoriot’s time series storage.
3

Descriptive Insights

What is happening?
  • View real-time total consumption.
  • Track historical energy patterns.
  • Compare load by zone, floor, or tenant.
  • Measure energy intensity per square meter.
4

Diagnostic Insights

Why did it happen?
  • Compare current behaviour against baselines.
  • Link temperature, occupancy, and power usage.
  • Detect causes behind nighttime spikes or weekend usage.
  • Move from symptoms to causes.
5

Predictive Insights

What may happen next?
  • Forecast future energy demand.
  • Estimate peak load risks.
  • Identify seasonal trends.
  • Generate early warnings for high-load conditions.
6

Prescriptive Insights

What should be done?
  • Trigger alerts based on configurable rules.
  • Recommend corrective actions.
  • Support load shifting during peak tariff periods.
  • Escalate ESG deviations to management.

From passive infrastructure to measurable energy intelligence

With the Favoriot Insight Framework, buildings can move beyond reactive troubleshooting. Energy data becomes structured evidence for better decisions, stronger accountability, and clearer sustainability reporting.

Why it matters

Energy management affects cost, reliability, ESG, and governance

When energy behaviour becomes measurable, teams can act earlier and manage buildings with greater confidence.

💰

Financial Discipline

Energy costs are a controllable operational expense. Structured monitoring helps reduce waste and manage peak demand.

⚙️

Operational Reliability

Energy anomalies can signal equipment stress. Early detection protects assets and reduces sudden failures.

🌱

ESG and Sustainability

Time-stamped energy data supports carbon reporting, emissions tracking, and green building evidence.

📊

Governance

Energy performance becomes measurable, comparable, and reviewable across teams and buildings.

“Without trusted data, trusted insights cannot exist.”

“The building begins to think ahead rather than react late.”

“At this stage, insight is turned into action.”

Key Use Cases

Practical areas where Smart Energy Management delivers value

Each use case can move naturally across the six layers of the Favoriot Insight Framework.

1 Peak Demand Improvement
2 HVAC Performance Monitoring
3 Renewable Energy Performance Tracking
4 Tenant-Based Submeter Billing
5 Carbon Emission Conversion and Reporting
6 Executive Sustainability Dashboard

Ready to turn your building’s energy data into trusted decisions?

Favoriot can help your organisation strengthen cost control, sustainability performance, ESG credibility, and operational accountability through Smart Energy Management.

© 2026 Favoriot · Smart Energy Management · From Data to Decisions
Smart Chilli Fertigation Powered by Favoriot

Smart Chilli Fertigation Powered by Favoriot

May 27th, 2026 Posted by BLOG, Favoriot Insight Framework, HOW-TO, Internet of Things, IOT PLATFORM 0 thoughts on “Smart Chilli Fertigation Powered by Favoriot”
Smart Chilli Fertigation Powered by Favoriot Insight Framework
Project Challenge #4 | Smart Agriculture | Favoriot Insight Framework

Smart Chilli Fertigation Powered by Favoriot

A structured IoT and AIoT approach to help chilli farms move from raw sensor data to trusted fertigation decisions.

From Intent to Action

🌶️
Chilli Crop Intelligence

Monitor moisture, nutrients, temperature, humidity, and irrigation flow in real time.

💧
Smarter Fertigation

Reduce guesswork in irrigation and nutrient dosing through structured data.

📊
Decision-Ready Insights

Turn farm data into descriptive, diagnostic, predictive, and prescriptive guidance.

Why It Matters

Smart fertigation is not just about sensors

The real problem

Many farms collect data, but still struggle to decide when to irrigate, how much nutrient to apply, and when crop stress is about to happen.

Smart Chilli Fertigation solves this by structuring farm data into a clear decision flow. The goal is not only to display readings, but to help farm operators act at the right time.

Smart Chilli Fertigation is not simply about installing sensors in a farm. It is about structuring data into meaningful insights.

Favoriot Insight Framework

Six layers from farm intent to automated action

Layer 1

Intent and Context

Why data is collected

Before deploying devices, the farm must define the real objectives behind the project.

  • Identify operational problems such as inconsistent yield, nutrient imbalance, or excessive water usage.
  • Define optimal growth conditions for chilli plants.
  • Set risk thresholds for soil moisture, EC, pH, temperature, and humidity.
  • Agree on intervention actions when thresholds are exceeded.
Outcome: Clear objectives guide sensor deployment and rule configuration.
Layer 2

Data Foundation

Capturing farm reality

This layer creates reliable data collection and storage across greenhouse or open-field zones.

  • Soil moisture sensors at root zone.
  • Electrical conductivity sensors for nutrient concentration.
  • pH sensors for nutrient absorption monitoring.
  • Temperature, humidity, and light intensity sensors.
  • Flow meters and nutrient tank level sensors.
Outcome: Trusted data supports trusted insights.
Layer 3

Descriptive Insights

Understanding what is happening

Once data is collected, farm operators need visibility across the full fertigation process.

  • Real-time dashboards for soil moisture, EC, pH, and environmental conditions.
  • Trend analysis and historical performance comparisons.
  • Situational awareness across multiple fertigation zones.
  • Detection of overwatering patterns and EC fluctuations.
Outcome: Farm conditions become visible without manual checking.
Layer 4

Diagnostic Insights

Understanding why it happened

Farms need more than charts. They need to understand the cause behind abnormal readings and crop issues.

  • Cross-sensor correlation analysis.
  • Comparison of nutrient behaviour against environmental conditions.
  • Identification of abnormal irrigation flow patterns.
  • Early anomaly detection across multiple farm zones.
Outcome: Farm management moves from symptoms to causes.
Layer 5

Predictive Insights

Understanding what may happen

With historical data, predictive models can help anticipate issues before visible crop stress appears.

  • Forecast soil moisture depletion rates.
  • Estimate nutrient consumption patterns.
  • Predict heat stress conditions.
  • Detect early warning signals before wilted leaves or fruit drop.
Outcome: Farm managers act earlier, not after damage is seen.
Layer 6

Prescriptive Insights

Determining what should be done

The final layer converts predictions into controlled actions and clear recommendations.

  • Rule-based automation for irrigation pump activation.
  • Automated nutrient dosing adjustments.
  • Alerts and recommendations for farm managers.
  • Controlled escalation and action logging.
Outcome: Insight becomes action while operators remain in control.
Project Challenges Addressed

What smart chilli fertigation solves

01

Irrigation Inefficiency

Data-driven irrigation replaces manual estimation.

02

Nutrient Wastage

Continuous EC and pH monitoring reduces over-application.

03

Climate Exposure

Real-time alerts help protect crops from heat and humidity risks.

04

Limited Visibility

Central dashboards monitor multiple plots at the same time.

05

Weak Analytics

Historical and predictive insights guide better yield planning.

From reactive farming to structured cultivation intelligence

The Favoriot Insight Framework helps farms organize their data pipeline from clear intent to reliable data, insights, prediction, and guided action.


Instead of reacting to wilted leaves or fruit drop, farm managers anticipate potential issues.

🌱

Better Yield Consistency

Helps maintain stable growing conditions for healthier chilli production.

💧

Less Water Waste

Supports irrigation based on actual farm conditions.

🧪

Better Nutrient Control

Monitors EC and pH to reduce nutrient imbalance.

📈

Scalable Farm Operations

Supports expansion across more greenhouse or open-field zones.

Ready to build a smarter fertigation system?

Favoriot can help agricultural operators, greenhouse managers, agri-tech integrators, and cooperatives design a structured IoT and AIoT system tailored to real farm operations.

© 2026 Favoriot. Smart Chilli Fertigation powered by the Favoriot Insight Framework.

Flood Monitoring and Early Warning System Using IoT

May 24th, 2026 Posted by BLOG, Favoriot Insight Framework, HOW-TO, Internet of Things, IOT PLATFORM 0 thoughts on “Flood Monitoring and Early Warning System Using IoT”
Flood Monitoring and Early Warning System | Favoriot Insight Framework
Flood Monitoring and Early Warning System

Turn flood data into earlier action.

Floods rarely announce themselves loudly at the beginning. A river rises. A drain fills. Rainfall builds. The real challenge is turning these signals into operational intelligence before the situation becomes harder to manage.

Using the Favoriot Insight Framework, municipalities and infrastructure operators can connect rainfall, hydrology, drainage, coastal conditions, and infrastructure health into one decision layer.

Live Risk Intelligence
River Level Rising Trend alert based on multi-sensor correlation
Drainage Pump Status Maintenance alert triggered before failure escalates
The core challenge

Flood response fails when data remains scattered.

Many flood operations still depend on manual inspection, public complaints, delayed field reports, or dashboards that show data without guiding the next action.

🌧️

Limited real-time visibility

Teams lack a shared view across river basins, drains, reservoirs, pumps, and vulnerable zones.

⚠️

Delayed alerts

Alerts often arrive after water levels have crossed critical points, reducing the window for prevention.

🛰️

Fragmented agencies

Rainfall, tide, drainage, and infrastructure data often sit in different systems without a common operational view.

“The challenge is not the absence of sensors. The challenge is the absence of structured operational intelligence.”

From the flood monitoring proposal narrative
What must be monitored

Flood intelligence must combine more than water level.

An effective system looks at the full chain of flood risk, from rainfall and river flow to pumps, tide levels, terrain, power, and sensor health.

Meteorological

  • Rainfall intensity
  • Cumulative rainfall
  • Storm movement
  • Humidity and temperature

Hydrological

  • River water level
  • Flow rate and discharge
  • Reservoir levels
  • Soil moisture

Urban Infrastructure

  • Drain water level
  • Pump status
  • Blockage detection
  • Floodgate position

Coastal and Tidal

  • Tide level
  • High tide timing
  • Storm surge level
  • Sea level anomalies

Terrain and Environment

  • Topography
  • Slope gradient
  • Land use
  • Riverbank stability

Station Health

  • Power supply status
  • Network availability
  • Sensor diagnostics
  • Battery levels
Favoriot Insight Framework

A layered system from field sensors to command decisions.

The proposal structures flood monitoring as a complete AIoT solution, not a standalone dashboard.

01

Device Layer

Rain gauges, water-level sensors, flow meters, soil moisture sensors, weather stations, tide sensors, and pump status devices.

02

Data Ingestion and Connectivity

Secure device authentication with telemetry streaming through MQTT, REST API, HTTPS, NB-IoT, LTE, LoRaWAN, or Ethernet gateways.

03

Data Management

Time-series storage, data normalization, device grouping, tagging, and historical access for analysis.

04

Rule Engine and Automation

Multi-condition logic that correlates rainfall, river rise, pump status, reservoir capacity, and high tide conditions.

05

Predictive Insight

Trend analysis, water-level forecasting, rainfall-runoff modelling, time-to-threshold prediction, and risk scoring.

06

Visualisation and Command Centre

Geospatial maps, heatmaps, river basin dashboards, flood risk zoning, and historical comparison charts.

07

Notification, Escalation, and Integration

Tiered alerts through SMS, email, Telegram, APIs, emergency platforms, GIS systems, and public alert systems.

“This is not merely a monitoring initiative. It is a shift from reactive disaster management to proactive urban resilience.”

From the flood monitoring proposal narrative
Operational use cases

Designed for real response, not passive observation.

📢

Early community warning

Automated alerts notify authorities and community leaders when risk thresholds are reached.

🏞️

Reservoir and dam management

Predictive capacity alerts support controlled water release planning and safer coordination.

🧰

Urban drainage operations

Drainage and pump stations can be monitored in real time for maintenance, activation, and escalation.

🏙️

Smart city command centre

Flood intelligence becomes part of a broader urban operations dashboard for multi-agency action.

Project roadmap

Five phases to move from risk mapping to operational use.

1

Site Risk Assessment

Identify vulnerable zones and define sensor needs.

2

Sensor Deployment

Install and connect monitoring devices.

3

Platform Setup

Configure dashboards, alerts, data streams, and rules.

4

Predictive Models

Build forecasting logic and risk classification scoring.

5

Training and Handover

Train operators and move the system into daily operations.

Expected outcomes

Better preparedness through connected intelligence.

Reduced response time
Improved evacuation planning
Stronger agency coordination
Lower infrastructure damage
Enhanced public safety
Better mitigation planning
Governance and security

Trust must be built into the system.

A flood monitoring system handles operational data that may trigger public warnings and emergency response. It must protect data quality, access, and accountability.

  • Secure device authentication
  • Encrypted data transmission
  • Role-based access control
  • Audit logging and monitoring

“Monitoring these parameters collectively enables holistic flood intelligence rather than isolated observations.”

From the flood monitoring proposal narrative

Build flood resilience before the next warning.

Favoriot helps government agencies, local councils, and infrastructure operators design an integrated Flood Monitoring and Early Warning System powered by real-time data, automation, predictive insight, and coordinated response.

Favoriot · From data to decisions · Flood Monitoring and Early Warning System using the Favoriot Insight Framework

Copyright © 2026 All rights reserved