
FAVORIOT Use Case: Turning Electrical Data Into Earlier Action
September 27th, 2026 Posted by favoriotadmin BLOG, Favoriot Insight Framework, HOW-TO, Internet of Things, Operational Blindness, PARTNER 0 thoughts on “FAVORIOT Use Case: Turning Electrical Data Into Earlier Action”Many facilities already generate large amounts of electrical data. The challenge is often not whether the data exists, but whether operations teams can see and understand it at the moment when action is still possible.
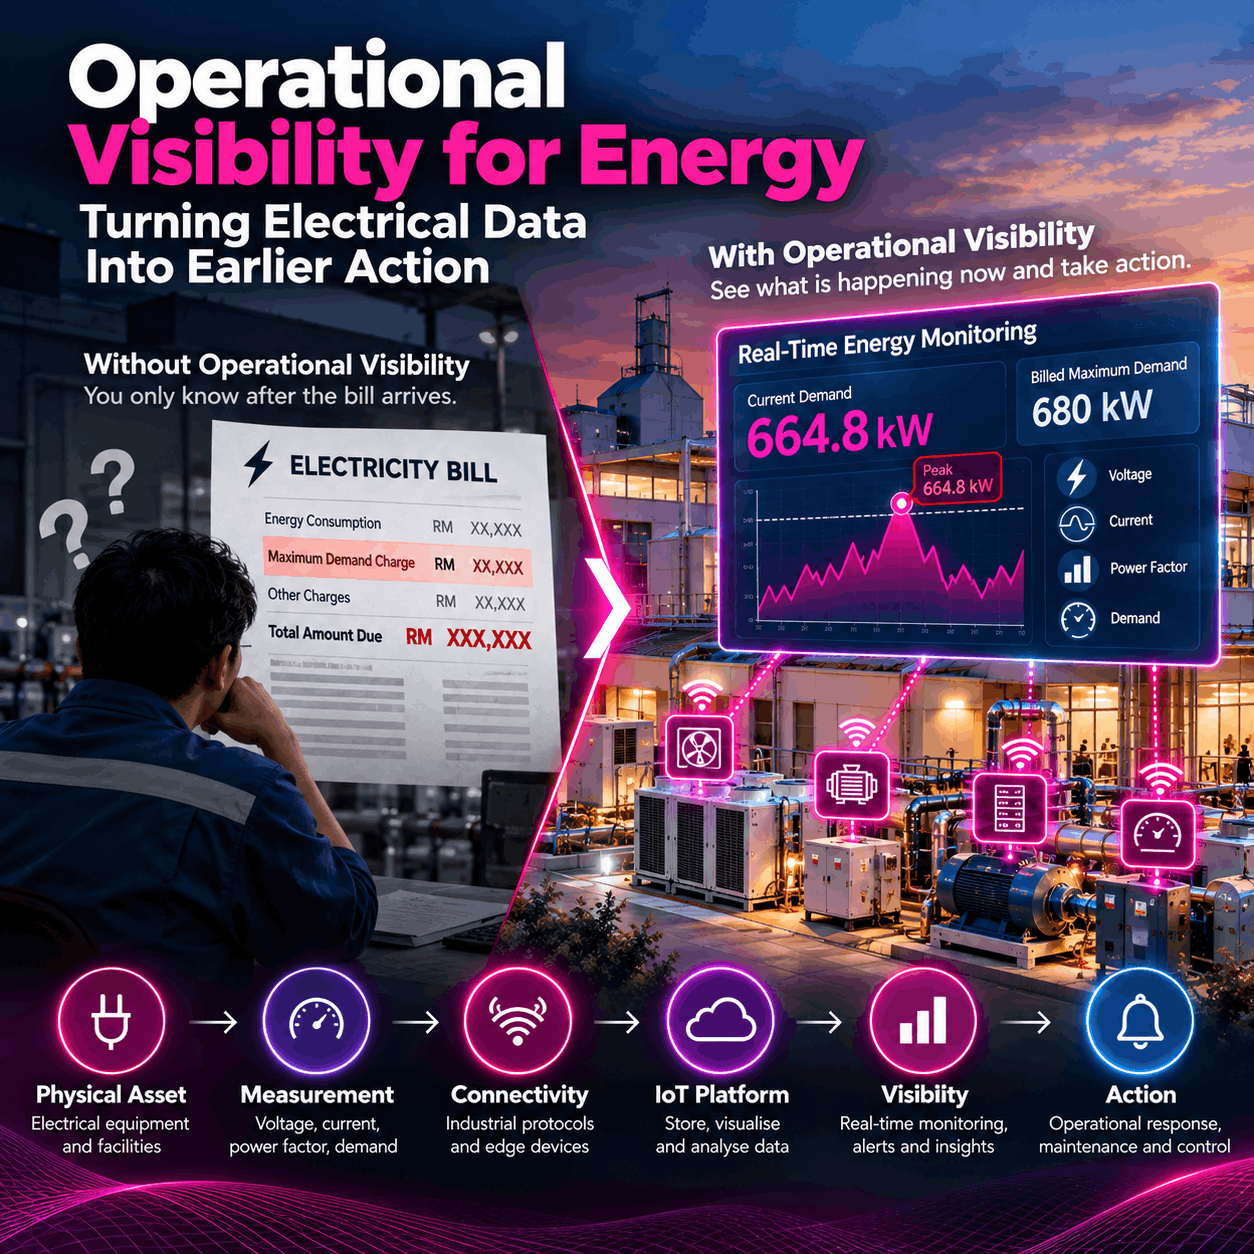
Maximum Demand provides a clear example. When multiple electrical loads operate simultaneously, total demand can rise rapidly. If operators only discover the peak through a later electricity bill or periodic report, the financial impact has already occurred.
An Operational Visibility approach changes this by connecting field measurements to continuous monitoring, alerts and historical analysis.
From Electrical Equipment to Operational Information
A real-time monitoring architecture can begin with electrical parameters such as voltage, current, power factor and demand.
These measurements can pass through industrial communication protocols and edge devices before being transmitted to an IoT platform. The platform then becomes the operational layer where data is stored, visualised, analysed and converted into alerts or other actions.
The architecture can be viewed simply as:
Physical Asset → Measurement → Connectivity → IoT Platform → Visibility → Action
Each layer serves a purpose, but the business value appears at the final two stages.
Connecting equipment alone does not solve operational blindness. The data must become understandable to the people responsible for operating the facility.
What Operational Visibility Changes
With continuous visibility, operations teams can move from asking what happened last month to asking what is happening now.
They can monitor whether demand is approaching a threshold, identify unusual changes, compare current conditions with historical patterns and investigate what operational activities coincide with peak periods.
In a real-world implementation, a monitoring system captured a demand peak of 664.8 kW, compared with a 680 kWMaximum Demand recorded for billing.
The significance is not simply measurement accuracy. It demonstrates that operational data can become visible while events are unfolding rather than after their financial consequences appear.
Connect, See and Act
This represents three fundamental stages of operational visibility.
Connect physical equipment and collect meaningful data.
See equipment conditions, patterns, abnormalities and changes as they occur.
Act through alerts, operational responses, maintenance decisions or automated rules.
Artificial intelligence and machine learning can extend this model further. Historical data can be analysed to detect abnormal consumption, recognise patterns associated with demand peaks and provide earlier warnings.
The system can gradually move from telling operators what is happening toward helping them understand what may happen next.
The Bigger Opportunity
Maximum Demand monitoring is only one use case. The same architecture can be applied to pumps, HVAC systems, generators, water infrastructure, renewable-energy assets, industrial machines and equipment distributed across remote sites.
The common problem is operational blindness.
Equipment may already be producing signals about changing conditions, but those signals often remain trapped inside machines, controllers, meters or isolated systems.
An Operational Visibility Platform connects those signals to the people who need them.
The objective is not to create more dashboards. It is to reduce the time between something changing in the physical world and somebody being able to respond.
That is where connected data begins to create operational value.
[Note: This is one of Favoriot‘s Use Case – Energy Monitoring]