

Posts tagged "middleware"

Smart Chilli Fertigation Powered by Favoriot

Smart Chilli Fertigation Powered by Favoriot

May 27th, 2026 Posted by BLOG, Favoriot Insight Framework, HOW-TO, Internet of Things, IOT PLATFORM 0 thoughts on “Smart Chilli Fertigation Powered by Favoriot”
Smart Chilli Fertigation Powered by Favoriot Insight Framework
Project Challenge #4 | Smart Agriculture | Favoriot Insight Framework

Smart Chilli Fertigation Powered by Favoriot

A structured IoT and AIoT approach to help chilli farms move from raw sensor data to trusted fertigation decisions.

From Intent to Action

🌶️
Chilli Crop Intelligence

Monitor moisture, nutrients, temperature, humidity, and irrigation flow in real time.

💧
Smarter Fertigation

Reduce guesswork in irrigation and nutrient dosing through structured data.

📊
Decision-Ready Insights

Turn farm data into descriptive, diagnostic, predictive, and prescriptive guidance.

Why It Matters

Smart fertigation is not just about sensors

The real problem

Many farms collect data, but still struggle to decide when to irrigate, how much nutrient to apply, and when crop stress is about to happen.

Smart Chilli Fertigation solves this by structuring farm data into a clear decision flow. The goal is not only to display readings, but to help farm operators act at the right time.

Smart Chilli Fertigation is not simply about installing sensors in a farm. It is about structuring data into meaningful insights.

Favoriot Insight Framework

Six layers from farm intent to automated action

Layer 1

Intent and Context

Why data is collected

Before deploying devices, the farm must define the real objectives behind the project.

  • Identify operational problems such as inconsistent yield, nutrient imbalance, or excessive water usage.
  • Define optimal growth conditions for chilli plants.
  • Set risk thresholds for soil moisture, EC, pH, temperature, and humidity.
  • Agree on intervention actions when thresholds are exceeded.
Outcome: Clear objectives guide sensor deployment and rule configuration.
Layer 2

Data Foundation

Capturing farm reality

This layer creates reliable data collection and storage across greenhouse or open-field zones.

  • Soil moisture sensors at root zone.
  • Electrical conductivity sensors for nutrient concentration.
  • pH sensors for nutrient absorption monitoring.
  • Temperature, humidity, and light intensity sensors.
  • Flow meters and nutrient tank level sensors.
Outcome: Trusted data supports trusted insights.
Layer 3

Descriptive Insights

Understanding what is happening

Once data is collected, farm operators need visibility across the full fertigation process.

  • Real-time dashboards for soil moisture, EC, pH, and environmental conditions.
  • Trend analysis and historical performance comparisons.
  • Situational awareness across multiple fertigation zones.
  • Detection of overwatering patterns and EC fluctuations.
Outcome: Farm conditions become visible without manual checking.
Layer 4

Diagnostic Insights

Understanding why it happened

Farms need more than charts. They need to understand the cause behind abnormal readings and crop issues.

  • Cross-sensor correlation analysis.
  • Comparison of nutrient behaviour against environmental conditions.
  • Identification of abnormal irrigation flow patterns.
  • Early anomaly detection across multiple farm zones.
Outcome: Farm management moves from symptoms to causes.
Layer 5

Predictive Insights

Understanding what may happen

With historical data, predictive models can help anticipate issues before visible crop stress appears.

  • Forecast soil moisture depletion rates.
  • Estimate nutrient consumption patterns.
  • Predict heat stress conditions.
  • Detect early warning signals before wilted leaves or fruit drop.
Outcome: Farm managers act earlier, not after damage is seen.
Layer 6

Prescriptive Insights

Determining what should be done

The final layer converts predictions into controlled actions and clear recommendations.

  • Rule-based automation for irrigation pump activation.
  • Automated nutrient dosing adjustments.
  • Alerts and recommendations for farm managers.
  • Controlled escalation and action logging.
Outcome: Insight becomes action while operators remain in control.
Project Challenges Addressed

What smart chilli fertigation solves

01

Irrigation Inefficiency

Data-driven irrigation replaces manual estimation.

02

Nutrient Wastage

Continuous EC and pH monitoring reduces over-application.

03

Climate Exposure

Real-time alerts help protect crops from heat and humidity risks.

04

Limited Visibility

Central dashboards monitor multiple plots at the same time.

05

Weak Analytics

Historical and predictive insights guide better yield planning.

From reactive farming to structured cultivation intelligence

The Favoriot Insight Framework helps farms organize their data pipeline from clear intent to reliable data, insights, prediction, and guided action.


Instead of reacting to wilted leaves or fruit drop, farm managers anticipate potential issues.

🌱

Better Yield Consistency

Helps maintain stable growing conditions for healthier chilli production.

💧

Less Water Waste

Supports irrigation based on actual farm conditions.

🧪

Better Nutrient Control

Monitors EC and pH to reduce nutrient imbalance.

📈

Scalable Farm Operations

Supports expansion across more greenhouse or open-field zones.

Ready to build a smarter fertigation system?

Favoriot can help agricultural operators, greenhouse managers, agri-tech integrators, and cooperatives design a structured IoT and AIoT system tailored to real farm operations.

© 2026 Favoriot. Smart Chilli Fertigation powered by the Favoriot Insight Framework.

Flood Monitoring and Early Warning System Using IoT

May 24th, 2026 Posted by BLOG, Favoriot Insight Framework, HOW-TO, Internet of Things, IOT PLATFORM 0 thoughts on “Flood Monitoring and Early Warning System Using IoT”
Flood Monitoring and Early Warning System | Favoriot Insight Framework
Flood Monitoring and Early Warning System

Turn flood data into earlier action.

Floods rarely announce themselves loudly at the beginning. A river rises. A drain fills. Rainfall builds. The real challenge is turning these signals into operational intelligence before the situation becomes harder to manage.

Using the Favoriot Insight Framework, municipalities and infrastructure operators can connect rainfall, hydrology, drainage, coastal conditions, and infrastructure health into one decision layer.

Live Risk Intelligence
River Level Rising Trend alert based on multi-sensor correlation
Drainage Pump Status Maintenance alert triggered before failure escalates
The core challenge

Flood response fails when data remains scattered.

Many flood operations still depend on manual inspection, public complaints, delayed field reports, or dashboards that show data without guiding the next action.

🌧️

Limited real-time visibility

Teams lack a shared view across river basins, drains, reservoirs, pumps, and vulnerable zones.

⚠️

Delayed alerts

Alerts often arrive after water levels have crossed critical points, reducing the window for prevention.

🛰️

Fragmented agencies

Rainfall, tide, drainage, and infrastructure data often sit in different systems without a common operational view.

“The challenge is not the absence of sensors. The challenge is the absence of structured operational intelligence.”

From the flood monitoring proposal narrative
What must be monitored

Flood intelligence must combine more than water level.

An effective system looks at the full chain of flood risk, from rainfall and river flow to pumps, tide levels, terrain, power, and sensor health.

Meteorological

  • Rainfall intensity
  • Cumulative rainfall
  • Storm movement
  • Humidity and temperature

Hydrological

  • River water level
  • Flow rate and discharge
  • Reservoir levels
  • Soil moisture

Urban Infrastructure

  • Drain water level
  • Pump status
  • Blockage detection
  • Floodgate position

Coastal and Tidal

  • Tide level
  • High tide timing
  • Storm surge level
  • Sea level anomalies

Terrain and Environment

  • Topography
  • Slope gradient
  • Land use
  • Riverbank stability

Station Health

  • Power supply status
  • Network availability
  • Sensor diagnostics
  • Battery levels
Favoriot Insight Framework

A layered system from field sensors to command decisions.

The proposal structures flood monitoring as a complete AIoT solution, not a standalone dashboard.

01

Device Layer

Rain gauges, water-level sensors, flow meters, soil moisture sensors, weather stations, tide sensors, and pump status devices.

02

Data Ingestion and Connectivity

Secure device authentication with telemetry streaming through MQTT, REST API, HTTPS, NB-IoT, LTE, LoRaWAN, or Ethernet gateways.

03

Data Management

Time-series storage, data normalization, device grouping, tagging, and historical access for analysis.

04

Rule Engine and Automation

Multi-condition logic that correlates rainfall, river rise, pump status, reservoir capacity, and high tide conditions.

05

Predictive Insight

Trend analysis, water-level forecasting, rainfall-runoff modelling, time-to-threshold prediction, and risk scoring.

06

Visualisation and Command Centre

Geospatial maps, heatmaps, river basin dashboards, flood risk zoning, and historical comparison charts.

07

Notification, Escalation, and Integration

Tiered alerts through SMS, email, Telegram, APIs, emergency platforms, GIS systems, and public alert systems.

“This is not merely a monitoring initiative. It is a shift from reactive disaster management to proactive urban resilience.”

From the flood monitoring proposal narrative
Operational use cases

Designed for real response, not passive observation.

📢

Early community warning

Automated alerts notify authorities and community leaders when risk thresholds are reached.

🏞️

Reservoir and dam management

Predictive capacity alerts support controlled water release planning and safer coordination.

🧰

Urban drainage operations

Drainage and pump stations can be monitored in real time for maintenance, activation, and escalation.

🏙️

Smart city command centre

Flood intelligence becomes part of a broader urban operations dashboard for multi-agency action.

Project roadmap

Five phases to move from risk mapping to operational use.

1

Site Risk Assessment

Identify vulnerable zones and define sensor needs.

2

Sensor Deployment

Install and connect monitoring devices.

3

Platform Setup

Configure dashboards, alerts, data streams, and rules.

4

Predictive Models

Build forecasting logic and risk classification scoring.

5

Training and Handover

Train operators and move the system into daily operations.

Expected outcomes

Better preparedness through connected intelligence.

Reduced response time
Improved evacuation planning
Stronger agency coordination
Lower infrastructure damage
Enhanced public safety
Better mitigation planning
Governance and security

Trust must be built into the system.

A flood monitoring system handles operational data that may trigger public warnings and emergency response. It must protect data quality, access, and accountability.

  • Secure device authentication
  • Encrypted data transmission
  • Role-based access control
  • Audit logging and monitoring

“Monitoring these parameters collectively enables holistic flood intelligence rather than isolated observations.”

From the flood monitoring proposal narrative

Build flood resilience before the next warning.

Favoriot helps government agencies, local councils, and infrastructure operators design an integrated Flood Monitoring and Early Warning System powered by real-time data, automation, predictive insight, and coordinated response.

Favoriot · From data to decisions · Flood Monitoring and Early Warning System using the Favoriot Insight Framework

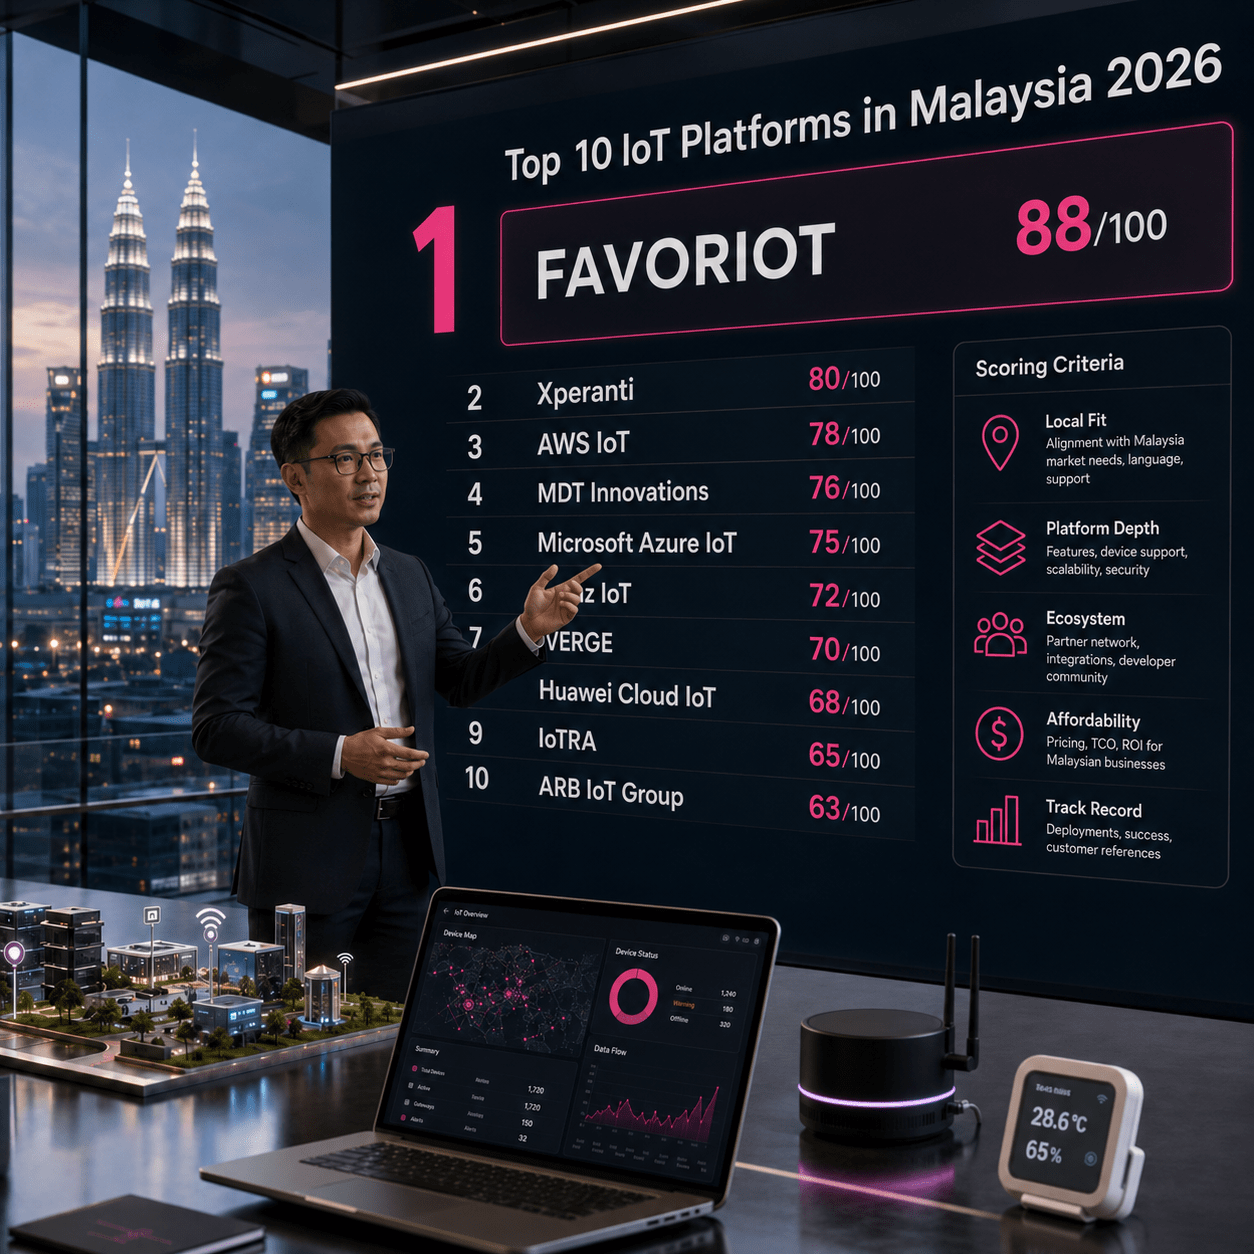
Top 10 IoT Platforms in Malaysia 2026

May 11th, 2026 Posted by BLOG, Internet of Things, IOT PLATFORM, NEWS 0 thoughts on “Top 10 IoT Platforms in Malaysia 2026”
Top 10 IoT Platforms in Malaysia 2026
IoT World Analyst View 2026

Top 10 IoT Platforms in Malaysia

Malaysia’s IoT market is moving beyond dashboards and pilots. The real question now is which platform can turn connected devices into operational value.

Market Context

The IoT platform race is no longer only about features.

A few years ago, many organisations were still asking how to connect sensors and show readings on a dashboard. In 2026, the market is asking harder questions.

Can the platform support real operations? Can it scale beyond one pilot? Can the pricing work for Malaysian councils, universities, factories, farms, and system integrators? Can local teams get support when something breaks after office hours?

This ranking is based on an AI-assisted market scan using five criteria. It should not be treated as a formal audited market report. It is a structured view of platform positioning, local relevance, perceived adoption strength, and practical fit for Malaysia.

Scoring Criteria

Five factors that matter in Malaysia

Each platform was scored out of 100 across five areas. The scoring favours platforms that can move from proof-of-concept to practical deployment in the Malaysian market.

1

Local Fit

How well the platform suits Malaysian market needs, regulations, user maturity, and deployment realities.

2

Platform Depth

Features, APIs, analytics, device management, dashboards, security, and scalability.

3

Ecosystem

Partners, device connections, developer community, documentation, and solution network.

4

Affordability

Pricing accessibility for local businesses, universities, project owners, and system integrators.

5

Track Record

Deployments, customer visibility, public reputation, and confidence built through real use cases.

The strongest IoT platform is not always the one with the longest feature list. It is the one that helps users move from sensor data to confident action.

Quote 1
Final Leaderboard

Top 10 IoT Platforms in Malaysia 2026

The leaderboard shows a clear pattern. Global platforms win on technical depth and ecosystem strength, while Malaysian-built platforms compete strongly on local fit and adoption practicality.

RankPlatformScoreAnalyst Note
1FAVORIOT88/100Best overall local fit with strong practical adoption potential.
2Xperanti80/100Strong connectivity and Malaysian IoT network positioning.
3AWS IoT78/100Excellent platform depth but lower local affordability and ease of adoption.
4MDT Innovations76/100Established local IoT player with practical solution orientation.
5Microsoft Azure IoT75/100Strong enterprise platform, but can be complex for smaller teams.
6Inchz IoT72/100Focused strength in asset tracking, supply chain, and practical industry use cases.
7VERGE70/100Connectivity-oriented IoT proposition with local relevance.
8Huawei Cloud IoT68/100Technically capable cloud platform with mixed local platform visibility.
9IoTRA65/100Local potential, but lower public visibility and ecosystem strength.
10ARB IoT Group63/100Broad IoT services position with room to strengthen platform identity.
Platform Analysis

What each platform brings to the market

Each provider has a different role. Some are platform-first. Some are connectivity-led. Some are stronger as end-to-end solution providers.

Rank 1

FAVORIOT

88/100

FAVORIOT ranks first because it performs strongly across all five criteria, especially local fit, affordability, and practical platform readiness for Malaysian users.

20Local Fit
18Depth
17Ecosystem
18Price
15Record
Rank 2

Xperanti

80/100

Xperanti has strong Malaysian IoT connectivity positioning and is relevant for wide-area, low-power deployments across sectors.

19Local Fit
16Depth
15Ecosystem
16Price
14Record
Rank 3

AWS IoT

78/100

AWS IoT is extremely strong in depth and ecosystem, but Malaysian adoption may face cost, complexity, and skill barriers.

12Local Fit
20Depth
20Ecosystem
10Price
16Record
Rank 4

MDT Innovations

76/100

MDT Innovations has local IoT experience and a solution-oriented position across sensors, IoT services, and analytics.

18Local Fit
16Depth
14Ecosystem
15Price
13Record
Rank 5

Microsoft Azure IoT

75/100

Azure IoT is well suited for enterprise architecture, especially organisations already invested in Microsoft cloud services.

12Local Fit
19Depth
19Ecosystem
11Price
14Record
Rank 6

Inchz IoT

72/100

Inchz IoT has focused relevance in RFID, IoT, asset tracking, supply chain, and energy monitoring use cases.

17Local Fit
15Depth
13Ecosystem
15Price
12Record

Malaysia does not need more dashboards that nobody acts on. It needs platforms that help teams see, decide, and respond faster.

Quote 2
Market Insight

The global platform dilemma

AWS, Azure, and Huawei are technically strong. The problem is not capability. The problem is adoption friction.

Global platforms win on depth.

They offer broad cloud services, strong developer ecosystems, global scalability, and rich security features. They are strong choices for large enterprises with skilled cloud teams.

  • Deep platform services
  • Large partner ecosystem
  • Enterprise cloud credibility
  • Strong global documentation

Local platforms win on practical fit.

For many Malaysian users, success depends on faster onboarding, local support, understandable pricing, training, and use cases that match actual field conditions.

  • Closer local support
  • Better fit for universities and SMEs
  • Lower learning curve
  • More practical deployment path
Why FAVORIOT Leads

The strongest overall fit for Malaysia

FAVORIOT did not rank first because it is the largest IoT platform in the world. It ranked first because it scores consistently across the factors that matter most to Malaysia.

A Malaysian IoT platform does not need to copy AWS or Azure feature by feature to win. It needs to solve Malaysian problems better.

It needs to help students learn faster. It needs to help lecturers teach real IoT projects. It needs to help system integrators deliver with less friction. It needs to help businesses connect sensors, see data, act on alerts, and make better operational decisions.

That is where the next stage of competition will happen.

The next winners in IoT will not be judged by how many devices they connect, but by how many decisions they improve.

Quote 3
Final View

The question every IoT buyer should ask in 2026

The 2026 IoT platform race in Malaysia will not be decided by technical depth alone. It will be decided by whether the platform can fit local needs, help users learn quickly, scale from pilot to real deployment, offer sensible pricing, and support customers when projects become operational.

The global giants will continue to dominate in cloud depth and worldwide ecosystem strength. Malaysian-built platforms have a real opening where adoption, affordability, local trust, and deployment practicality matter most.

For Malaysia, this is a healthy sign. It means the IoT conversation is maturing. We are no longer only asking which platform has the most features. We are asking which platform can help Malaysia turn connected devices into real operational value.

Ready to turn IoT data into operational value?

Explore how FAVORIOT can help organisations, system integrators, universities, and developers build practical IoT solutions faster.

© 2026 IoT World. Analyst-style article webpage based on an AI-assisted platform ranking.

Copyright © 2026 All rights reserved