Most IoT budgets get spent in the wrong order. A company decides it wants visibility into a process, picks a sensor or a piece of equipment that looks right on paper, and only afterward starts asking whether the thing can actually talk to a platform. By then the purchase order is signed, the vendor has been paid, and someone on the technical team is quietly trying to figure out why a device that works perfectly on the factory floor refuses to send a single reading anywhere useful.
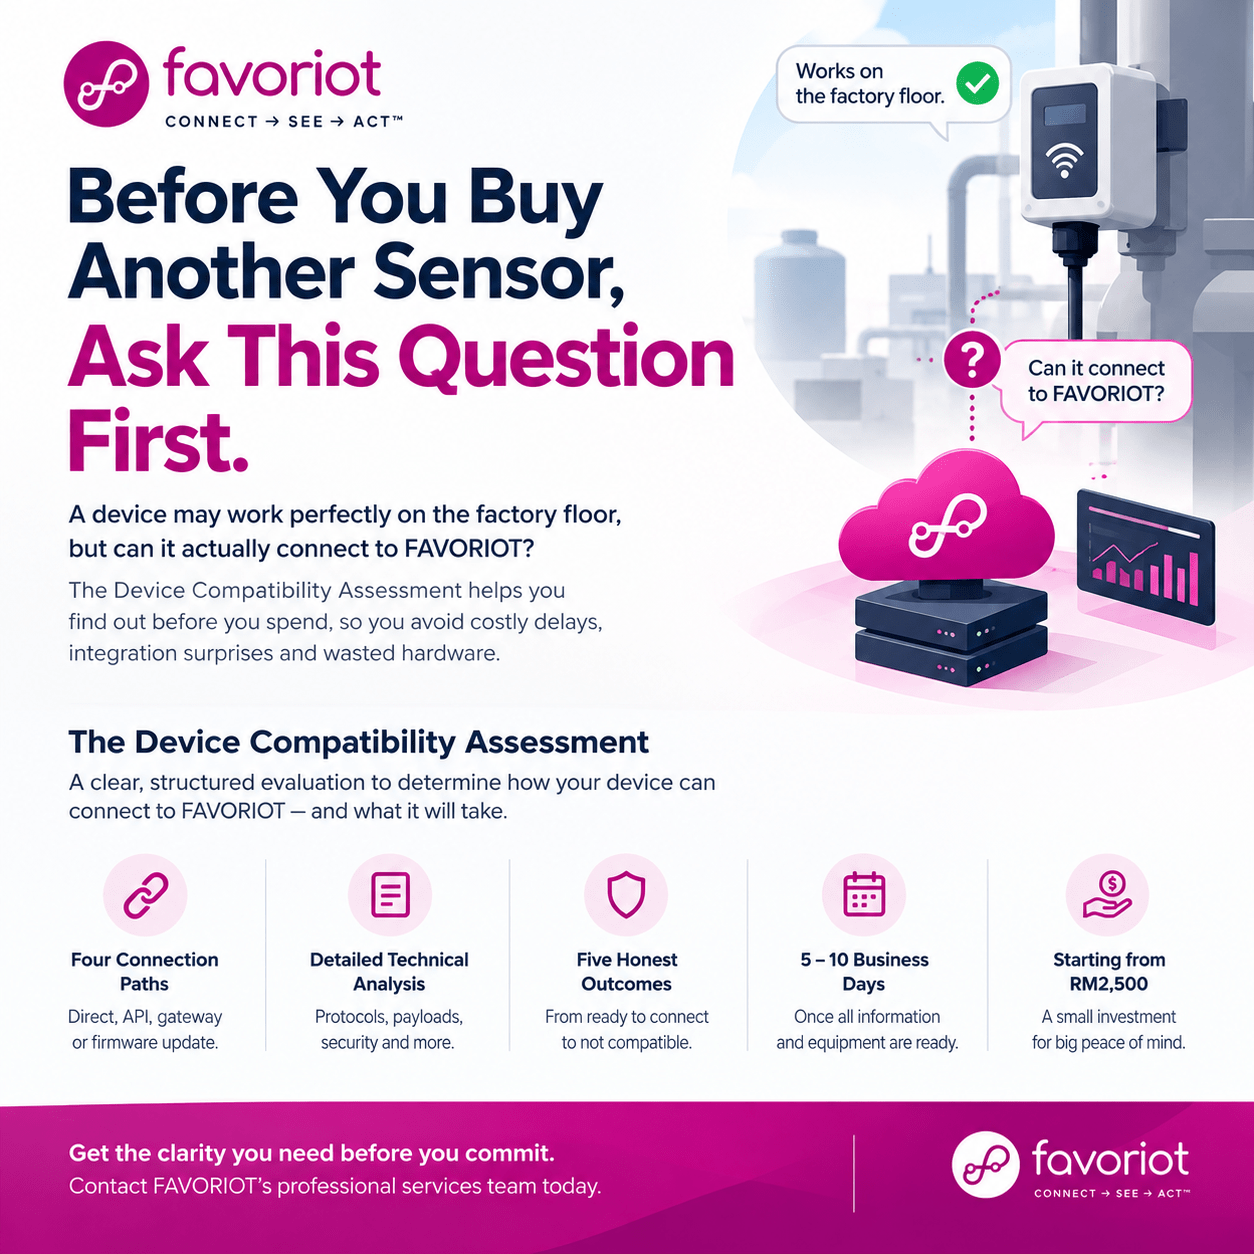
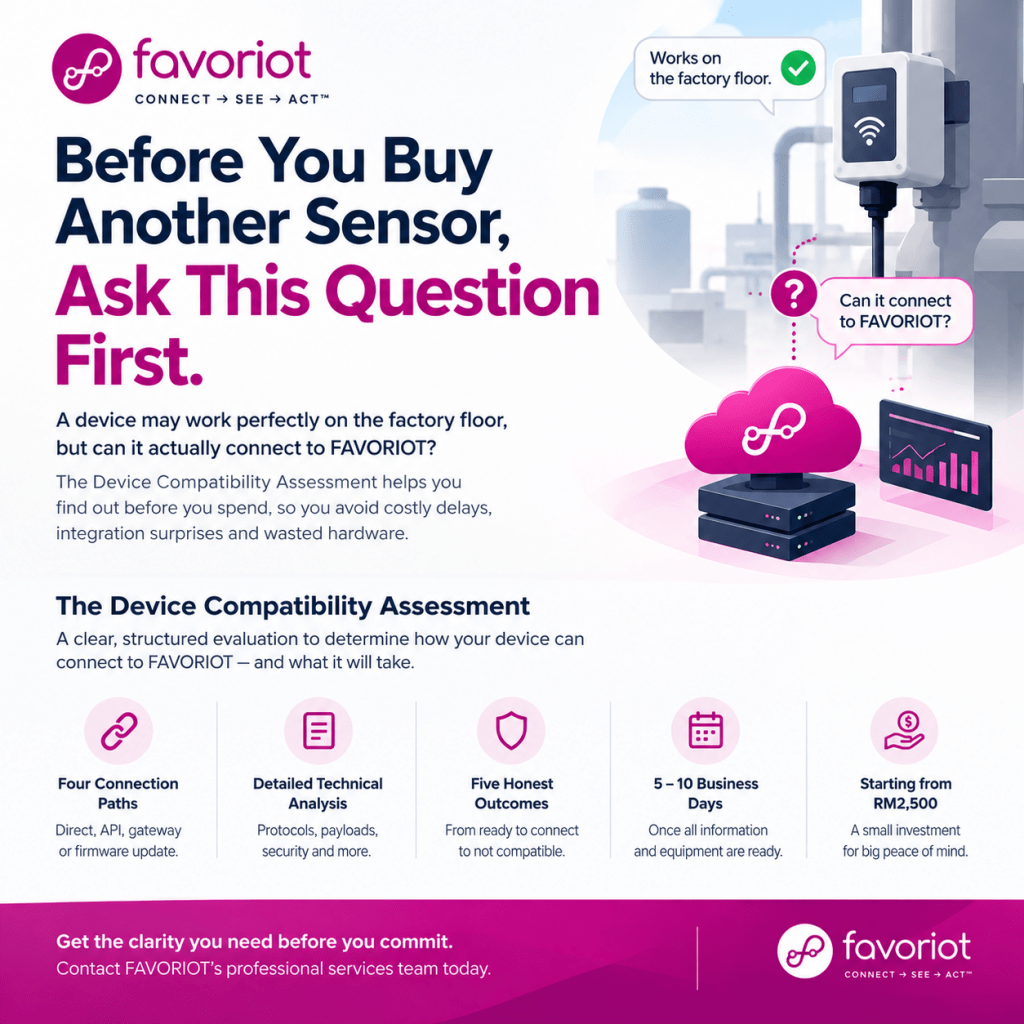
FAVORIOT has now built a service specifically to catch this problem before it becomes an expensive discovery: the Device Compatibility Assessment.
The Gap Between “It Works” and “It Connects”
A device functioning correctly and a device being ready to integrate are two different things, and the difference is rarely obvious until someone tries to bridge them. A sensor might use a proprietary protocol nobody documented. A machine’s PLC might expose data only through a vendor API that requires credentials nobody thought to request. An older piece of equipment might need a firmware update just to speak a language the rest of the system understands.
None of this shows up in a product brochure. It shows up weeks into a project, usually after budget has already been committed to hardware, and usually as a delay nobody planned for.
What the Assessment Actually Determines
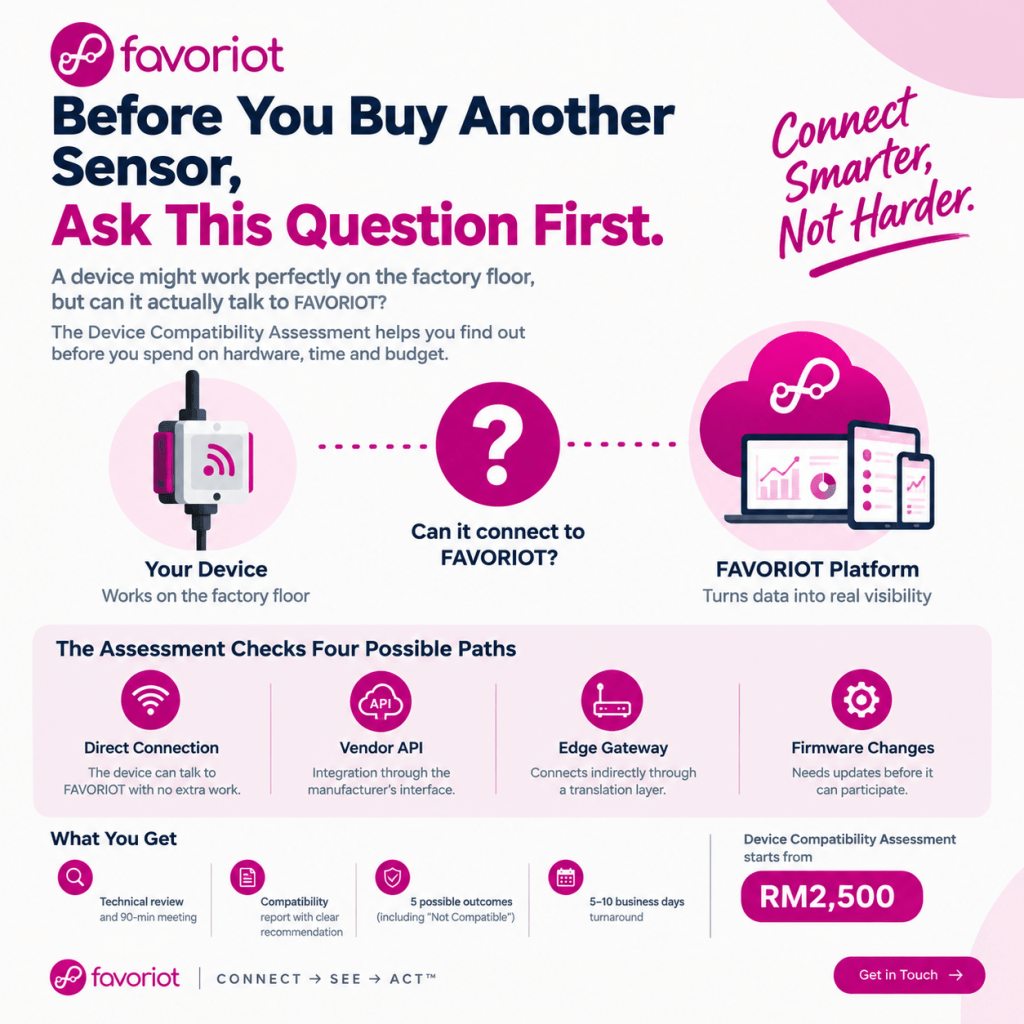
The Device Compatibility Assessment exists to answer one specific question before any commitment is made: can this device connect to FAVORIOT, and if so, how? The assessment looks at four possible paths:
Direct connection – the device can talk to FAVORIOT with no extra work.
A documented vendor API – integration happens through the manufacturer’s own interface.
An edge gateway or protocol converter – the device connects indirectly through a translation layer.
Firmware changes – the device needs updates before it can participate at all.
Each assessment covers one clearly defined configuration, meaning one manufacturer, model, and firmware version, tested against one communications method. That narrow scope is deliberate. A tighter assessment produces a clearer answer than a broad one that tries to cover too much ground at once.
What’s Involved on Both Sides
The process works best as a two-way exchange of information rather than a black box exercise. On FAVORIOT’s side, the assessment includes a remote review, a technical meeting of up to 90 minutes, a review of protocols and payload structure, a look at authentication and security requirements, and a written compatibility report at the end.
On the customer’s side, a few things need to be ready before the clock starts:
The exact brand, model, and firmware version of the device in question
Datasheets and configuration manuals
Protocol, API, and payload documentation
Administrative access and a vendor contact, where relevant
A working test device, when physical testing is needed
Remote access, if a live connection attempt is required
Skipping any of these does not stop the assessment from happening, but it usually stretches the timeline out.
Five Honest Outcomes, Not One Optimistic One
What makes this service worth paying for is that it does not promise a yes. Every assessment ends in one of five clearly labeled outcomes: Ready for direct connection, API Ready through a documented vendor interface, Gateway Ready via a converter, Conditional pending vendor cooperation or firmware work, or Not Currently Compatible due to insufficient access, documentation, or a safe connection route.
That last category matters as much as the first. A report that says a device will not work right now, and explains exactly why, saves far more money than a vague assurance that everything will probably be fine. It also gives a technical team something concrete to bring back to a vendor, rather than a shrug.
Turnaround runs five to ten business days once all required information and equipment are in hand, and the assessment fee applies regardless of which of the five outcomes comes back. That detail is worth stating plainly rather than burying in fine print: the value of the service is the clarity itself, not a guaranteed green light.
Where This Fits Into a Bigger Decision
Not every organisation needs this service. A team that already knows its device inventory speaks MQTT or REST and has the documentation to prove it can likely skip straight to integration. But for anyone standing at the start of a deployment with a mix of legacy equipment, newly purchased sensors, and a deadline that assumes everything will just work, an assessment starting at RM2,500 is a small line item compared to the cost of finding out the hard way, mid-project, that a device was never going to connect at all.
Organisations weighing a new IoT deployment, or trying to make sense of equipment they already own, are welcome to reach out to FAVORIOT‘s professional services team (or contact info@favoriot.com ) to see whether this is the right first step.
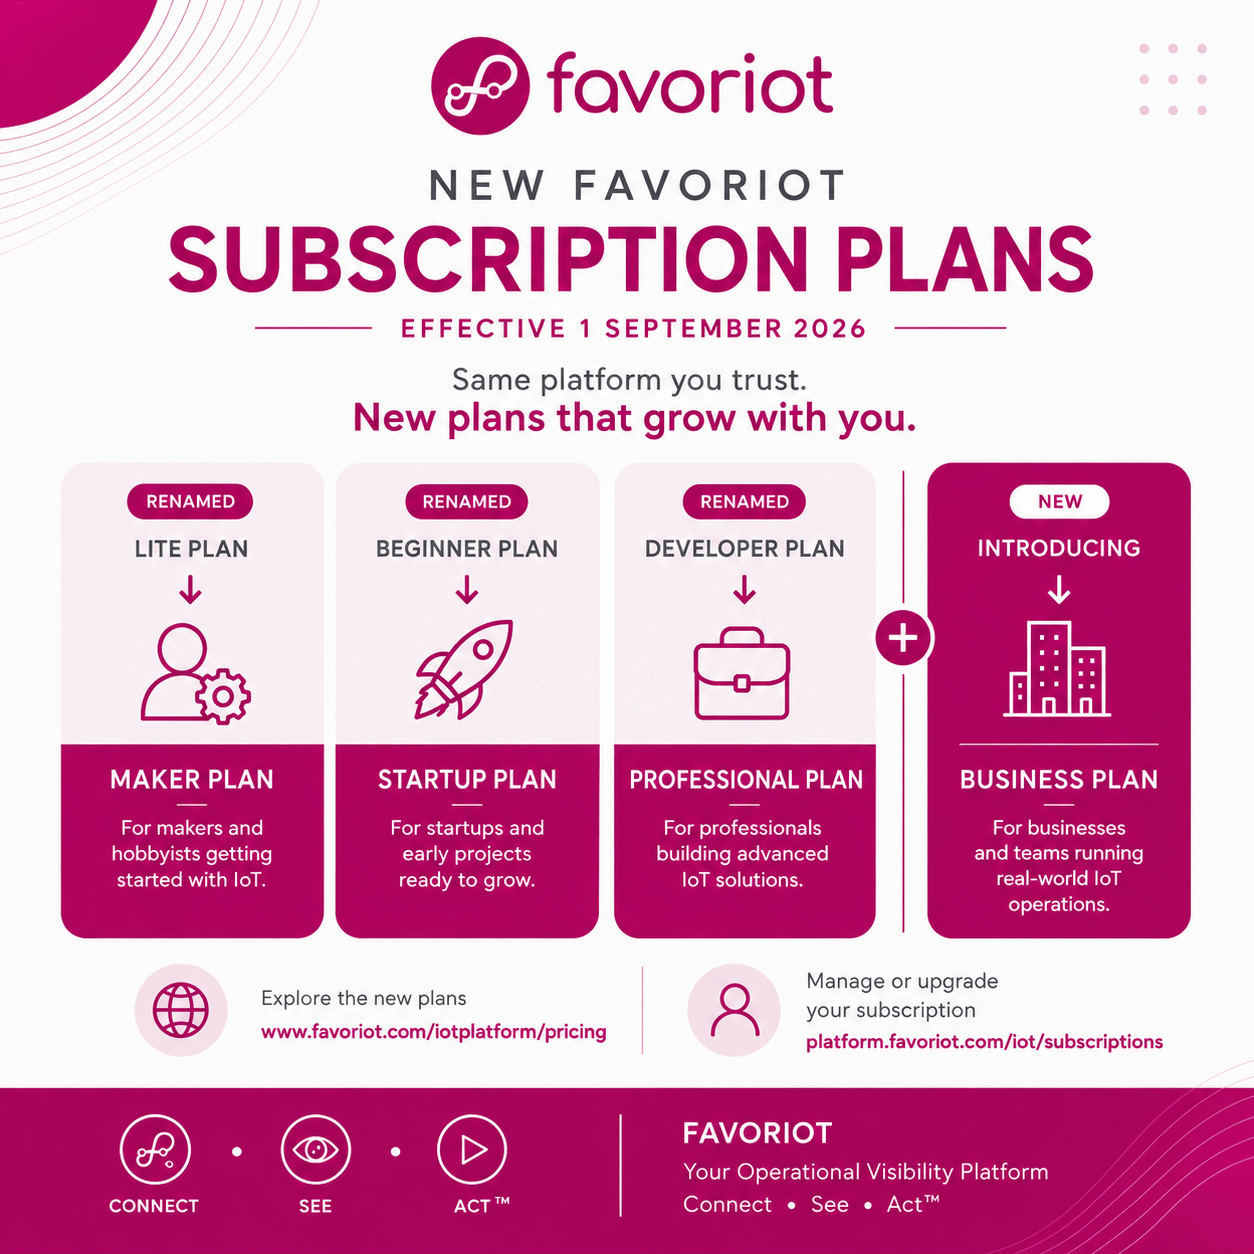
Effective today, 1 September 2026, we are introducing a new structure for the FAVORIOT subscription plans.
As FAVORIOT continues to serve different types of users, from individual makers and startups to professionals and businesses, we have renamed our existing plans to better reflect how they are being used. A new pricing is also announced.
The changes are:
• Lite Plan → Maker Plan • Beginner Plan → Startup Plan • Developer Plan → Professional Plan
We are also introducing a NEW subscription tier:
⭐ Business Plan
The Business Plan provides another step for users whose IoT projects are moving beyond individual development and require a plan better suited for business and operational use.
If you are currently using FAVORIOT, please take a look at the new plan structure and see which plan best matches what you are building today.
View the new FAVORIOT plans: https://www.favoriot.com/iotplatform/pricing
Manage or upgrade your subscription: https://platform.favoriot.com/iot/subscriptions
Thank you for being part of the FAVORIOT community.
Crowdsourced Air-Quality Monitoring Using the FAVORIOT Developer Plan
1. Project concept
Malaysia AirWatch is a citizen-supported air-quality monitoring project. Schools, universities, community groups, businesses and individual volunteers install low-cost sensor stations at their locations.
Each station measures local air conditions and sends the readings to the FAVORIOT platform. The combined data appears on a public map showing air-quality patterns across Malaysia.
The project does not replace the Department of Environment’s official monitoring stations. It provides denser, neighbourhood-level observations that may help people identify local changes, pollution hotspots and unusual events.
The basic flow is:
flowchart LR
    A["Community sensor"] --> B["Wi-Fi or 4G"]
    B --> C["FAVORIOT"]
    C --> D["Quality checks"]
    D --> E["Public map"]
    D --> F["Alerts and analysis"]
2. Project objectives
The project should pursue five clear objectives:
Collect PM2.5 and PM10 data from many Malaysian locations.
Build a public community air-quality map.
involve schools, universities and citizens in environmental monitoring.
Detect unusual pollution patterns at neighbourhood level.
Create a national dataset for education, research and public awareness.
A good pilot target would be:
100 monitoring stations
At least 10 states
Urban, suburban and rural locations
One reading every five minutes
Six months of continuous operation
At least 85% station uptime
3. Why the FAVORIOT Developer Plan fits
The current Developer Plan costs RM300 per month or RM3,000 per year. It includes:
500,000 API calls per day
Unlimited devices
Unlimited private and public dashboards
Up to 30 widgets per dashboard
Map widgets
Device connectivity status
Data import and export
Edge Gateway
Firmware OTA
Advanced analytics and machine-learning models
Email and Telegram notifications
HTTP POST forwarding to external systems
Customer accounts with designated access
One-year data retention
These features make it suitable for a national crowdsourcing pilot. FAVORIOT pricing page
Estimated platform capacity
If each station sends one message every five minutes:
288\ messages\ per\ station\ per\ day
Number of stations
Messages per day
Developer Plan usage
100
28,800
5.8%
500
144,000
28.8%
1,000
288,000
57.6%
1,500
432,000
86.4%
Theoretically, one Developer Plan can support about 1,700 stations at five-minute intervals. A safer operational ceiling would be around 1,300 to 1,500 stations, leaving capacity for testing, device management, retries and external applications.
4. Choose what the stations will measure
Required measurements
Every station should measure:
PM2.5
PM10
Temperature
Relative humidity
Temperature and humidity matter because low-cost particulate sensors can be affected by environmental conditions.
Optional measurements
Selected research-grade stations may also measure:
Carbon dioxide
Carbon monoxide
Nitrogen dioxide
Ozone
Volatile organic compounds
Atmospheric pressure
Noise level
I would not put every sensor into the first version. Gas sensors can produce misleading readings without proper calibration. Start with PM2.5, PM10, temperature and humidity.
5. Build the standard AirWatch station
Recommended components
Component
Purpose
ESP32 development board
Reads sensors and sends data
PMS5003, PMS7003 or SPS30
Measures PM2.5 and PM10
BME280 or SHT31
Measures temperature and humidity
Wi-Fi connectivity
Sends data through the host’s internet connection
Weather-resistant enclosure
Protects the electronics
Ventilation openings
Allows air to reach the sensor
5V power supply
Powers the station
Unique QR code
Identifies and registers the station
For locations without Wi-Fi, use:
4G LTE router or modem
LoRaWAN gateway where local coverage exists
Store-and-forward memory when connectivity is interrupted
Estimated hardware cost
Station type
Estimated cost
Basic educational station
RM180–RM300
Better outdoor community station
RM350–RM650
4G-connected station
RM600–RM1,000
Reference or calibration station
RM3,000 and above
These are planning estimates. The final cost depends on sensor model, enclosure, power and connectivity.
6. Define where sensors may be installed
Participants should place stations:
Under a sheltered outdoor area
Between 1.5 and 3 metres above ground
Away from kitchen exhausts
Away from cigarette-smoking areas
Away from direct rain
Away from air-conditioning outlets
With unrestricted airflow
Where the Wi-Fi signal is stable
Where power is continuously available
The project should record the installation environment:
Roadside
Residential
School
University
Industrial vicinity
Commercial
Rural
Agricultural
Coastal
Forest-edge
Without this context, two readings may appear comparable when they are actually taken under very different conditions.
7. Create the FAVORIOT project structure
Create the following hierarchy in FAVORIOT:
Project
Malaysia AirWatch
Applications
Community Air Quality Monitoring
Station Health Monitoring
Research and Analytics
Public Air Quality Map
Groups
Groups can represent states:
Johor
Kedah
Kelantan
Melaka
Negeri Sembilan
Pahang
Penang
Perak
Perlis
Sabah
Sarawak
Selangor
Terengganu
Kuala Lumpur
Putrajaya
Labuan
For a larger deployment, create subgroups using districts or station categories.
Device naming convention
Use a consistent device ID:
MY-[STATE]-[DISTRICT]-[NUMBER]
Examples:
MY-SGR-PUCHONG-001
MY-JHR-JB-003
MY-SWK-KUCHING-012
Do not use a volunteer’s name, house address or telephone number in the device ID.
8. Design the data payload
Each station should send a consistent JSON payload:
FAVORIOT supports HTTPS, MQTT, WebSocket and CoAP for device connectivity. Each device can be given its own access token rather than sharing the account’s main API key. FAVORIOT platform documentation
9. Protect participant privacy
Exact household coordinates should not be displayed publicly.
Use two location levels:
Exact coordinates: kept in the private administration records.
Public coordinates: rounded or displaced by approximately 500 metres to 1 kilometre.
Public participants should see only:
Station ID
General area
District and state
Latest readings
Historical trend
Station status
Sensor type
Last update time
The registration form should explain:
What information will be collected
Which information will be public
Who owns the contributed data
How the data may be used
How participants can withdraw
Whether researchers may download the dataset
10. Develop the sensor firmware
The ESP32 firmware should perform these steps:
Start the particulate, temperature and humidity sensors.
Connect to Wi-Fi.
Synchronise the clock.
Allow the particulate sensor to stabilise.
Take several readings.
Remove clearly invalid measurements.
Calculate a short average.
Send the payload to FAVORIOT over HTTPS or MQTTS.
Confirm successful transmission.
Save failed readings locally.
Retry when connectivity returns.
Report station-health information.
Check for firmware updates.
Recommended sampling:
Read sensors every 30 seconds.
Calculate the median or trimmed mean over five minutes.
Send one consolidated message every five minutes.
This reduces noise and consumes fewer API calls than transmitting every raw reading.
11. Test ten prototype stations
Do not immediately distribute 100 stations. Build ten prototypes first.
Place them in several conditions:
Two beside an official or trusted reference station
Two at universities
Two at schools
Two in residential areas
One near a busy road
One in a rural area
Run them for four weeks. During testing, check:
Differences between units
Humidity effects
Missing data
Sensor drift
Wi-Fi failures
Heat inside the enclosure
Rain protection
Firmware stability
Put all ten units beside one another for several days before deployment. This co-location test reveals whether one sensor consistently reads higher or lower than the others.
Station has passed co-location and installation checks
Provisional
Station is operating but has limited validation
Suspect
Reading failed one or more quality tests
Offline
No data received within the expected period
Maintenance
Station is being serviced
Rejected
Reading is physically impossible or corrupted
Automatic checks
Flag a reading when:
PM2.5 or PM10 is negative
PM2.5 is far higher than PM10
Temperature or humidity is outside plausible limits
The same reading repeats for an unusually long time
The value changes too sharply between intervals
The station has weak connectivity
The device clock is wrong
Readings diverge greatly from nearby stations
A high reading from one low-cost station should be treated as a signal to investigate, not proof of a pollution incident.
13. Build the FAVORIOT dashboards
Public national dashboard
Include:
Map of all active stations
Latest PM2.5 readings
Colour-coded air-quality categories
National average
Highest current readings
State comparison
Twenty-four-hour trend
Last update time
Explanation of the quality flags
Clear non-regulatory disclaimer
State dashboard
Include:
State map
District comparison
Hourly PM2.5 and PM10 trends
Seven-day trend
Active and offline stations
Locations with unusual readings
Technical dashboard
Keep this private for administrators:
Device connectivity status
Wi-Fi strength
Last message time
Firmware version
Sensor age
Missing-data rate
Battery or power status
Stations requiring maintenance
Research dashboard
Include:
PM2.5 versus humidity correlation
Weekday versus weekend patterns
Morning and evening peaks
Urban versus rural comparisons
Seasonal trends
Anomaly detection
Time-series forecasts
14. Configure rules and alerts
Create platform rules for:
Air-quality alerts
PM2.5 exceeds the project threshold for three consecutive readings
PM10 rises sharply within 30 minutes
Several nearby stations detect the same increase
Station-health alerts
No data for 20 minutes
Device repeatedly reconnects
Wi-Fi strength remains poor
Sensor produces fixed values
Firmware is outdated
Send technical alerts to the project team through Telegram or email. Avoid sending public health alerts until the measurements and interpretation method have been properly reviewed.
15. Recruit contributors
Potential participants include:
Public and private universities
Secondary schools
TVET institutions
Local councils
Resident associations
Environmental NGOs
Makerspaces
Technology companies
Factories and industrial parks
Farms and plantations
Citizen scientists
Participation models
Sponsor a station
A company pays for stations to be installed at schools or community centres.
Build your own station
Universities, students and makers assemble a station using the approved design.
Host a station
FAVORIOT supplies the station while the participant provides electricity, Wi-Fi and a suitable location.
Research partner
A university supports calibration, analysis and publication.
16. Create the contributor onboarding process
Every participant follows the same steps:
Apply through an online form.
Provide the general proposed location.
Choose to build, sponsor or host a station.
Accept the data-sharing and privacy terms.
Receive a station ID and QR code.
Follow the installation guide.
Upload installation photographs.
Run the station for a seven-day probation period.
Pass the data-quality review.
Appear on the public map.
The QR code can open the public station page and display its readings, history and validation status.
17. Run a 12-week pilot
Week
Main activity
Output
1
Confirm objectives, governance and measurements
Project charter
2
Select sensors and design enclosure
Hardware specification
3
Configure FAVORIOT hierarchy and payload
Working platform structure
4
Develop ESP32 firmware
First connected prototype
5
Assemble ten units
Prototype fleet
6
Conduct co-location testing
Baseline comparison
7
Improve hardware and correction method
Revised station
8
Install at pilot sites
Live field data
9
Create dashboards and maps
Public beta dashboard
10
Configure alerts and quality rules
Monitoring workflow
11
Recruit first community participants
Initial contributor network
12
Review results and approve expansion
Pilot report
18. Pilot budget
Ten-station pilot
Item
Estimated cost
Ten sensor stations at RM450
RM4,500
Spare sensors and components
RM1,000
Enclosures and installation materials
RM800
FAVORIOT Developer Plan, one year
RM3,000
SIM and data for selected sites
RM600
Calibration and field visits
RM2,000
Workshops and participant materials
RM1,500
Contingency
RM1,500
Estimated total
RM14,900
Internal staff time, travel across Malaysia and the development of a separate public web application would need their own allocation.
19. Success indicators
Technical indicators
At least 85% station uptime
At least 95% valid readings
Less than 10% missing data
Data delivered within ten minutes
All stations remotely identifiable
Firmware updates completed without visiting every station
Participation indicators
Ten states represented during the first phase
At least 20 partner organisations
At least 100 active contributors
At least five participating universities
At least ten participating schools
Data indicators
Six months of usable observations
Verified co-location results
Published data-quality method
Monthly community air-quality reports
At least three research or student projects using the data
20. How the project can grow
Phase 1: Ten-station technical pilot
Prove the sensor, firmware, platform and data-quality process.
Phase 2: One hundred community stations
Expand through universities, schools and resident associations.
Phase 3: Five hundred stations
Bring in local councils, corporate sponsors and environmental groups.
Phase 4: National operational network
Move to an Enterprise or dedicated arrangement when the project needs:
Multiple administrative organisations
Longer data retention
Higher API volume
Dedicated infrastructure
Formal service levels
Stronger data-governance controls
Links with government or emergency systems
21. Important public disclaimer
The dashboard should carry a clear statement:
Malaysia AirWatch uses low-cost community sensors to provide local environmental observations. Its readings are indicative and may be affected by sensor accuracy, placement, humidity and maintenance. The data should not be treated as an official Malaysian Air Pollutant Index or used alone for medical, regulatory or emergency decisions. Refer to the relevant Malaysian authorities for official air-quality information.
Suggested project message
Your neighbourhood’s air should not be invisible.
Malaysia AirWatch allows schools, universities, communities and citizens to help measure the air around them. One sensor may tell us what is happening at one location. Hundreds of connected sensors can help us see patterns across the country.
Build a station. Host a station. Sponsor a community. Help Malaysia see the air we breathe.