Posts in HOW-TO

From Environmental Monitoring to Predictive Public Health: A Favoriot Case Study on Dengue Forecasting

This IoT Project Predicted Dengue Before It Happened – A Favoriot Success Story

March 27th, 2026 Posted by BLOG, HOW-TO, Internet of Things, IOT PLATFORM 0 thoughts on “This IoT Project Predicted Dengue Before It Happened – A Favoriot Success Story”

Introduction

Dengue fever continues to pose a significant public health challenge in Malaysia and across many tropical regions. While efforts to manage outbreaks have improved over the years, most interventions remain reactive, often initiated only after cases begin to rise. This delay reduces the effectiveness of containment measures and increases the burden on healthcare systems.

What if outbreaks could be anticipated earlier?

What if environmental signals could be translated into actionable insights before infections spike?

This case study examines how a Malaysian university leveraged the Favoriot platform to enhance its research capabilities in predicting dengue outbreaks. By combining localised environmental monitoring with data analytics and machine learning, the university transitioned from general observation to data-driven prediction.

The Objective: Enabling Predictive Research

The university’s primary objective was to strengthen its research in dengue prediction by collecting localised environmental data. Rather than relying solely on generalised weather reports, the goal was to establish a system to capture real-time, site-specific environmental conditions that influence mosquito breeding and virus transmission.

This initiative aimed to:

  • Improve the accuracy of dengue prediction models
  • Provide researchers with high-quality, continuous datasets
  • Support early warning mechanisms for public health intervention

The Challenge: Limited Granularity in Environmental Data

One of the key challenges faced by the university was the lack of detailed and localised weather data.

Traditional weather monitoring systems typically operate at a regional level. While useful for general forecasting, they often fail to capture micro-environmental variations that are critical in understanding dengue dynamics.

Specifically, the university required:

  • High-resolution data across multiple locations
  • Real-time data availability for timely analysis
  • Integration of multiple environmental parameters in a single system

Without these capabilities, predictive modelling would remain limited in accuracy and reliability.

The Solution: Localised IoT-Enabled Weather Monitoring

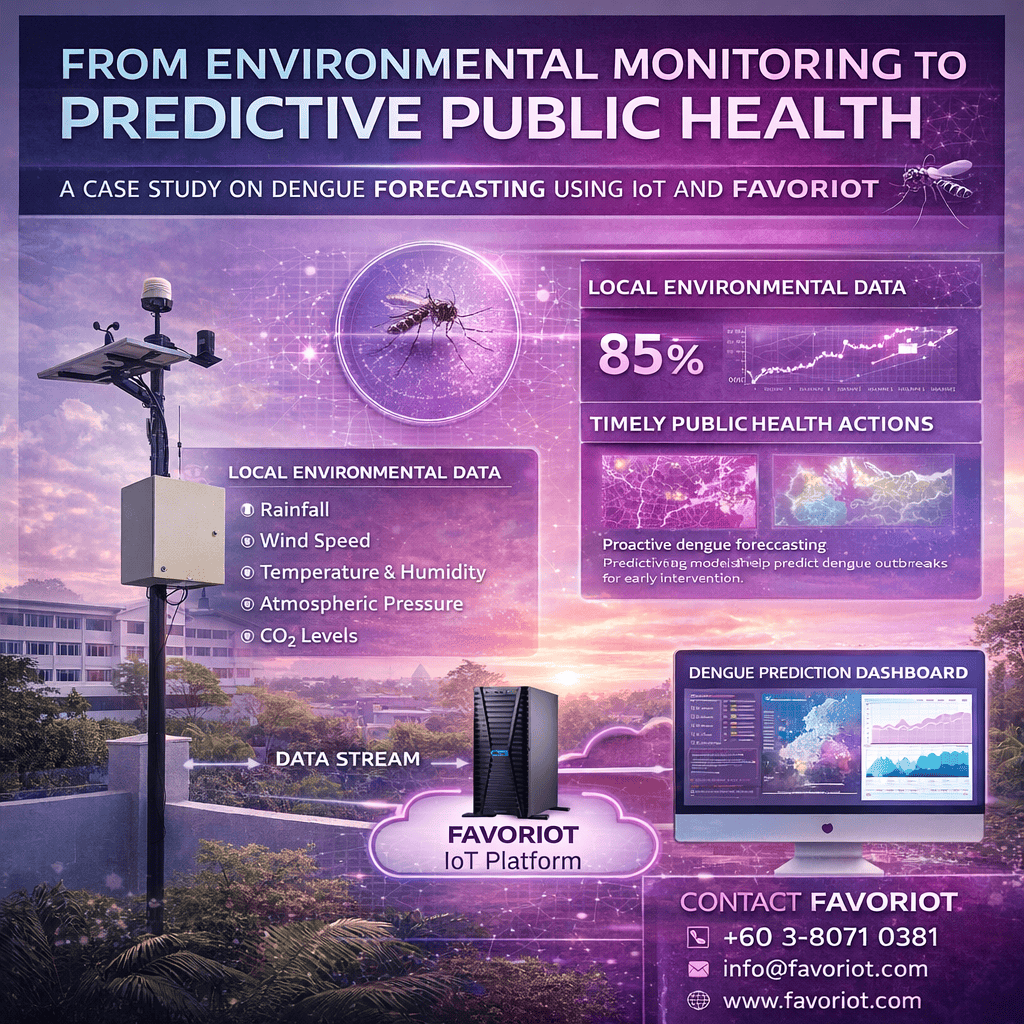
To address these challenges, Favoriot deployed a network of mini weather stations across strategic locations within and around the university campus.

Each station was equipped with sensors capable of measuring:

  • Rainfall
  • Wind speed
  • Atmospheric pressure
  • Temperature
  • Humidity
  • Carbon dioxide levels

These stations continuously collected environmental data and transmitted it to the Favoriot IoT platform for centralised processing and analysis.

This approach ensured that data was collected at the source, providing a more accurate reflection of local environmental conditions.

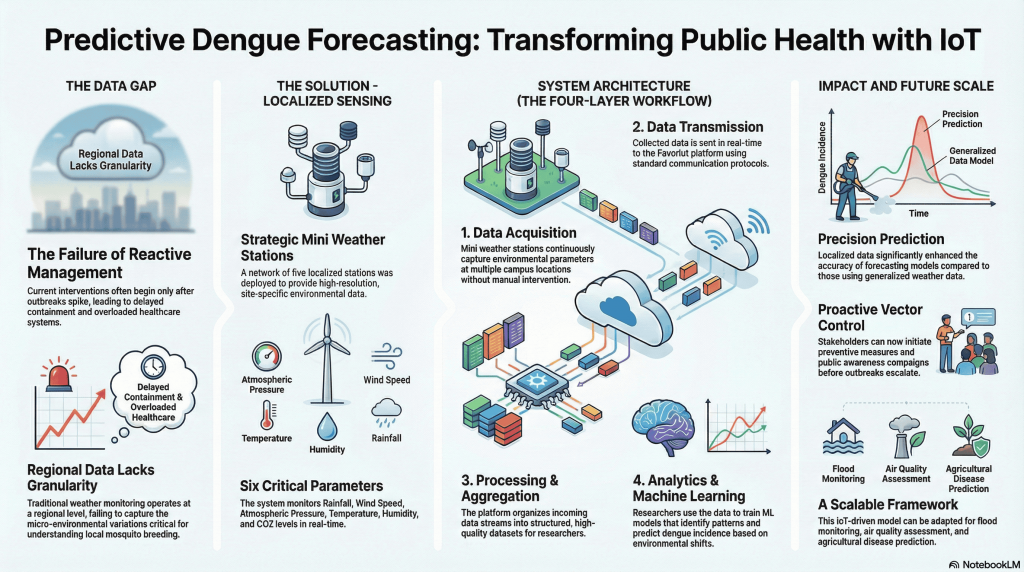
System Architecture: From Data Acquisition to Insight

The overall system architecture can be described in four key layers:

1. Data Acquisition

Mini weather stations continuously capture environmental parameters at multiple locations. This ensures consistent and reliable data input without manual intervention.

2. Data Transmission

Collected data is transmitted in real time to the Favoriot platform using standard communication protocols, enabling immediate availability for analysis.

3. Data Processing and Aggregation

The Favoriot platform aggregates incoming data streams, organises them into structured datasets, and prepares them for analytical processing.

4. Analytics and Machine Learning

Researchers utilise the processed data to develop and train machine learning models. These models identify patterns and correlations between environmental conditions and dengue incidence, improving prediction accuracy over time.

Implementation: Structured Deployment and Data Utilisation

The implementation of the system followed a systematic approach:

  • Strategic Deployment: Five mini weather stations were installed in carefully selected locations to ensure optimal data coverage.
  • Continuous Data Collection: Sensors operated continuously, providing real-time environmental data streams.
  • Centralised Data Management: All data was ingested and managed through the Favoriot platform.
  • Research Integration: Data was made accessible to researchers for analysis, modelling, and validation of predictive algorithms.

This structured deployment ensured that the system was both scalable and aligned with the university’s research objectives.

Results: Measurable Improvements in Prediction and Response

The deployment delivered several key outcomes:

Improved Data Accuracy

Localised data collection significantly enhanced the precision of environmental measurements. This allowed researchers to work with more reliable datasets compared to traditional sources.

Enhanced Predictive Modelling

Machine learning models trained on high-quality, localised data demonstrated improved performance in predicting dengue outbreaks. The ability to capture micro-environmental variations contributed to more accurate forecasting.

Support for Proactive Public Health Measures

With improved prediction capabilities, stakeholders can initiate preventive actions earlier. This includes targeted vector control measures, public awareness campaigns, and resource allocation before outbreaks escalate.

Key Insights: Moving Beyond Data Collection

This case highlights an important shift in how IoT is applied in research and public health.

The value of IoT does not lie solely in data collection, but in its ability to:

  • Provide context-rich, localised data
  • Enable continuous monitoring
  • Support advanced analytics and predictive modelling
  • Drive informed decision-making

By connecting environmental data to actionable insights, the university elevated its research from observation to prediction.

Broader Implications: A Scalable Model for Other Domains

The approach demonstrated in this project can be extended beyond dengue prediction.

Similar frameworks can be applied to:

  • Flood monitoring and early warning systems
  • Air quality assessment in urban areas
  • Agricultural disease prediction
  • Urban climate analysis

In each case, the combination of localised sensing, real-time data processing, and intelligent analytics can significantly improve outcomes.

Conclusion

This case study demonstrates how integrating IoT and data analytics can enhance research capabilities and drive real-world impact.

By deploying localised weather stations and leveraging the Favoriot platform, the university successfully improved its ability to predict dengue outbreaks. The result is not only better research outcomes but also a stronger foundation for proactive public health strategies.

The transition from reactive response to predictive insight represents a meaningful step forward in managing complex health challenges.

For Further Inquiry

Organisations interested in developing similar solutions for environmental monitoring, predictive analytics, or smart city applications are encouraged to connect with Favoriot:

Engage with Favoriot to explore how data can be transformed into actionable intelligence for your specific use case.

Favoriot ESG

Why IoT Has Become the Backbone of ESG Monitoring

February 10th, 2026 Posted by BLOG, HOW-TO, Internet of Things, IOT PLATFORM, PRODUCT 0 thoughts on “Why IoT Has Become the Backbone of ESG Monitoring”

ESG is no longer driven by intention statements or annual summaries. Today, organisations are expected to show evidence. Regulators want proof. Investors want consistency. Customers want transparency.

At the centre of this shift sits one critical enabler: IoT.

IoT transforms ESG reporting from a compliance obligation into an operational capability by capturing real-world data directly from assets, facilities, and environments. Without this layer of measurement, ESG metrics are often based on assumptions rather than facts.

ESG Needs Measured Reality, Not Estimates

Many organisations still depend on:

  • Periodic meter readings
  • Manual logs
  • Spreadsheets are updated once a quarter or once a year

These methods struggle to survive audits and increasingly fall short of modern disclosure expectations. ESG today demands data that is:

  • Continuous
  • Verifiable
  • Traceable to source

IoT fills this gap by collecting information automatically, consistently, and in real time.

How IoT Supports Each ESG Pillar

Environmental: Where IoT Plays the Largest Role

Environmental indicators are the most measurable and the most scrutinised. IoT enables direct monitoring of key environmental metrics such as:

  • Energy usage
    • Electricity consumption by machine, line, or facility
    • Peak demand and load behaviour
    • Renewable energy contribution
  • Emissions and air quality
    • CO₂ concentration
    • Particulate matter
    • Indoor air quality in controlled spaces
  • Water consumption
    • Inflow and discharge volumes
    • Leak detection
    • Process water usage
  • Waste tracking
    • Waste volumes
    • Recycling rates
    • Hazardous material handling

These measurements underpin carbon accounting, energy intensity reporting, and environmental risk management.

Social: Protecting People Through Data

IoT contributes to the Social pillar by improving visibility into workplace conditions, especially in operational environments.

Typical applications include:

  • Monitoring temperature and humidity on production floors
  • Detecting gas leaks or unsafe exposure levels
  • Identifying equipment conditions that could lead to accidents

In sectors such as manufacturing, construction, and energy, these indicators are closely linked to legal and ethical responsibilities.

Governance: Building Trust Through Data Integrity

Governance is not measured by sensors, but it depends on the quality of the data behind decisions.

IoT strengthens governance by:

  • Reducing manual intervention in data collection
  • Creating time-stamped, tamper-resistant records
  • Supporting audit readiness with clear data trails

When ESG figures are backed by operational data, governance moves from declarations to defensible accountability.

What ESG Monitoring Is Commonly Expected

While ESG rules vary by country and industry, several monitoring areas are widely treated as baseline requirements.

AreaESG PillarWhy It Matters
Energy consumptionEnvironmentalCarbon and efficiency metrics
Emissions dataEnvironmentalClimate-related disclosures
Water usageEnvironmentalResource risk and compliance
Pollution indicatorsEnvironmentalRegulatory and community impact
Worker safety metricsSocialDuty of care
Data traceabilityGovernanceAudit credibility

Organisations lacking reliable data in these areas often face delays, higher audit costs, and increased scrutiny.

Example: ESG Monitoring in a Manufacturing Factory

Consider a medium-sized factory operating multiple production lines.

Environmental Monitoring

  • Smart meters track electricity usage at:
    • Incoming power supply
    • Individual production lines
    • High-energy equipment such as compressors
  • Water flow sensors monitor:
    • Process water consumption
    • Cooling systems
    • Discharge points
  • Air quality sensors measure:
    • Indoor CO₂ levels
    • Particulate concentration
    • Ventilation effectiveness

This setup allows the factory to calculate energy intensity per unit produced, detect abnormal consumption early, and support environmental reporting with confidence.

Social Monitoring

  • Temperature and humidity sensors ensure safe working conditions
  • Gas detectors provide early alerts before exposure becomes dangerous
  • Equipment monitoring helps reduce accidents caused by malfunctioning machinery

Threshold breaches trigger alerts, enabling prompt corrective action.

Governance Enablement

All collected data is:

  • Logged automatically
  • Stored securely
  • Visualised through dashboards
  • Exportable for audits and ESG disclosures

This gives management visibility not just into outcomes, but also into actions taken when issues arise.

Turning IoT Data into ESG Insight

Raw sensor data alone is not enough. It must be structured, contextualised, and aligned with ESG indicators.

This is where an IoT platform becomes essential. Platforms like Favoriot help organisations manage data from multiple sensors, locations, and systems while presenting ESG-relevant insights through dashboards, alerts, and historical views. This makes ESG monitoring scalable across factories, buildings, and regions without adding operational complexity.

Closing Thoughts

ESG expectations continue to rise, and tolerance for estimates is shrinking.

IoT provides the foundation for:

  • Measurable environmental performance
  • Safer workplaces
  • Stronger governance backed by evidence

For organisations serious about ESG, monitoring is no longer optional. It is the starting point for trust, accountability, and long-term credibility.

Smart Cities and Favoriot

Widely Adopted Smart City Applications

February 9th, 2026 Posted by BLOG, HOW-TO, Internet of Things, IOT PLATFORM 0 thoughts on “Widely Adopted Smart City Applications”

Priorities, Implementation Challenges, and Practical Responses

Executive Summary

Cities worldwide are turning to smart city technologies to cope with rising urban demands, ageing infrastructure, and tighter operational budgets. While smart city visions often span many domains, real-world deployments show a consistent starting point. Most cities begin with a small set of applications that solve visible, operational problems and can be justified through clear outcomes.

This paper examines the three smart city application areas most commonly deployed globally and explains not only why they are prioritised, but also the key challenges cities face during implementation and practical approaches to overcoming them.

1. Smart Mobility and Traffic Management

Purpose and scope

Smart mobility systems focus on improving traffic flow, reducing congestion, and enhancing safety across urban road networks. Typical deployments include adaptive traffic signals, traffic flow monitoring, smart parking systems, and real-time visibility into public transport.

These systems rely on data collected from sensors, cameras, and transport assets to support operational decisions at both junction and network levels.

Why cities prioritise mobility

Traffic congestion directly affects productivity, fuel consumption, air quality, and emergency response. It is also highly visible to residents, making it a frequent political and operational concern.

Mobility projects are often prioritised because they deliver measurable results quickly, such as reduced waiting times or improved junction throughput. Existing road infrastructure also provides clear and accessible locations for sensor deployment.

Key challenges

Cities often encounter several issues when deploying smart mobility solutions:

  • Fragmented systems where traffic, parking, and public transport operate independently
  • Over-reliance on visual dashboards without linking insights to field operations
  • Limited data quality due to inconsistent sensor placement or calibration
  • Difficulty scaling pilot projects beyond selected corridors

Practical approaches

To address these challenges, cities should:

  • Begin with high-impact routes or congestion hotspots rather than attempting city-wide coverage
  • Link traffic alerts and insights directly to traffic control rooms and enforcement teams
  • Standardise data collection methods across sensors and systems
  • Design solutions with expansion in mind, allowing additional intersections and corridors to be added incrementally

2. Smart Energy and Utilities Management

Purpose and scope

Smart utility systems aim to improve visibility and control over electricity, water, and public infrastructure consumption. Typical applications include smart metering, street lighting control, water leak detection, and energy monitoring in public buildings.

These systems help cities understand where resources are consumed, wasted, or underperforming.

Why cities prioritise utilities

Utilities represent a large and recurring operational expense for municipalities. Energy losses, water leakage, and inefficient lighting often go unnoticed without continuous monitoring.

Smart utility projects are also closely linked to sustainability targets, climate commitments, and national energy reporting requirements, thereby strengthening their business case.

Key challenges

Common challenges in utilities deployments include:

  • Legacy infrastructure is not designed for digital monitoring
  • Data overload without clear thresholds or response actions
  • Limited coordination between utilities, facilities, and maintenance teams
  • Difficulty demonstrating savings without a clear baseline

Practical approaches

Cities can reduce these risks by:

  • Starting with assets that have known issues or high operating costs
  • Establishing baseline consumption measurements before optimisation
  • Defining clear alert thresholds and maintenance response workflows
  • Integrating operational monitoring with long-term reporting for finance and sustainability teams

3. Public Safety and Urban Surveillance

Purpose and scope

Public safety systems enhance situational awareness and support faster, better-coordinated responses to incidents. Typical deployments include CCTV networks, incident detection systems, emergency response coordination tools, and integrated command centres.

These systems are designed to support prevention, early detection, and response.

Why cities prioritise safety

Safety is a core responsibility of city authorities. Technologies that reduce response times and improve coordination across agencies are often treated as essential infrastructure.

Public safety projects also tend to receive public support when benefits such as faster emergency response and improved accountability are clearly demonstrated.

Key challenges

Public safety deployments often face:

  • Fragmentation between police, fire, medical, and city operations
  • High volumes of data require constant human monitoring
  • Privacy concerns and unclear governance structures
  • Technology deployments without agreed response procedures

Practical approaches

Effective public safety systems require:

  • Clearly defined response protocols before system activation
  • Integration across agencies rather than isolated deployments
  • Governance policies covering access control, data retention, and oversight
  • A shift from continuous monitoring to event-driven alerts that prompt action

Cross-Cutting Challenges Across Smart City Applications

Across all three application domains, cities commonly face shared issues:

  • Siloed systems managed by different departments or vendors
  • Difficulty scaling pilots into operational city-wide systems
  • Limited reuse of data across departments
  • Dependence on dashboards without operational integration

These challenges often stem from technology-first deployments that lack a unified operational strategy.

Platform Strategy as an Enabler

A shared IoT platform approach helps cities manage multiple applications within a consistent operational framework. This enables standardised data ingestion, common alerting rules, and shared access controls across departments.

Platforms such as FAVORIOT support multi-domain deployments by enabling cities to manage mobility, utilities, and safety use cases within a single environment while retaining the flexibility to grow and adapt over time.

Closing Perspective

Smart mobility, smart utilities, and public safety systems are widely adopted because they solve real problems and deliver measurable outcomes. Their success depends not only on technology, but on careful planning, phased deployment, and strong operational alignment.

Cities that address implementation challenges early and adopt a scalable platform strategy are better positioned to move from isolated projects toward coordinated, data-informed urban management.

Copyright © 2026 All rights reserved