Posts tagged "HOW-TO"

Favoriot Insight Framework

FAVORIOT AIoT PLAYBOOK

April 8th, 2026 Posted by BLOG, Favoriot Insight Framework, HOW-TO, Internet of Things, IOT PLATFORM, NEWS 0 thoughts on “FAVORIOT AIoT PLAYBOOK”

Building Real-World AIoT Solutions Using the Favoriot Insight Framework (FIF)

I’ve seen many teams start their IoT journey with energy… and then slowly lose momentum.

Not because they lack technology.
But because they lack structure.

So I asked myself one day:

What if we gave them a clear path… from idea to action?

That’s how this playbook is meant to be used.

PART 1: HOW TO USE THIS PLAYBOOK

Before we jump into the steps, let’s get one thing clear.

This is not a theory document.

This is a working guide for:

  • Favoriot training programs
  • AIoT solution design workshops
  • Real project deployments
  • Consultancy engagements

You can use this playbook in two ways:

1. As a Starting Guide

If you are new to AIoT, follow Steps 1-6 in sequence.

2. As a Diagnostic Tool

If you already have a system, use this to identify gaps:

  • Stuck at dashboards? You’re at Step 3
  • No predictive capability? You haven’t reached Step 5
  • No automation? You’re missing Step 6

PART 2: THE 6-STEP FIF EXECUTION MODEL

Let me walk you through this the same way I would in a real workshop.

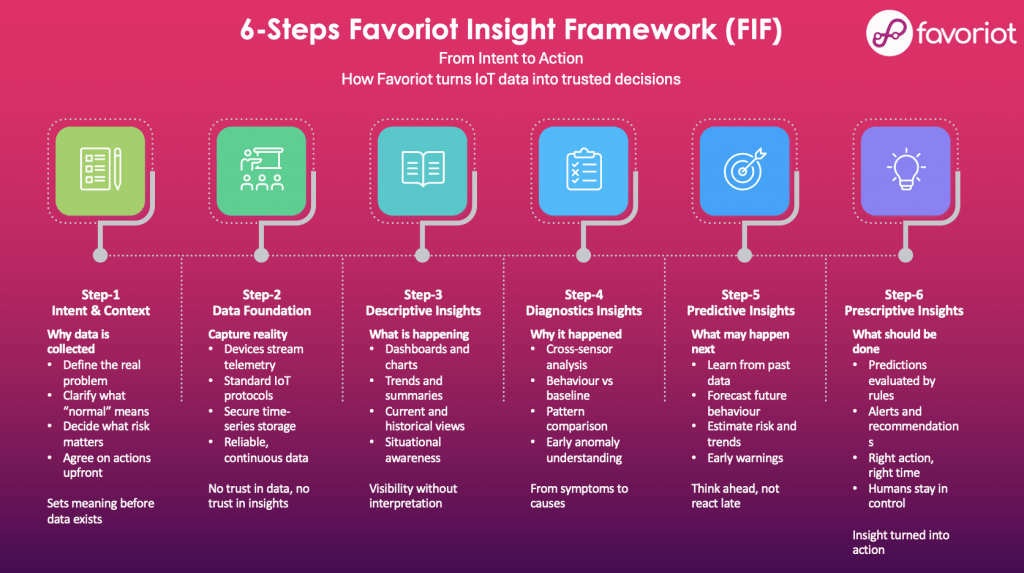
STEP 1: INTENT & CONTEXT

Define the Problem Before Touching Technology

I always pause here and ask:

“If we don’t collect a single data point… what decision are we trying to make?”

What You Must Do

  • Define the real problem, not the symptoms
  • Identify key risks (downtime, safety, cost, compliance)
  • Establish what “normal” looks like
  • Agree on what actions should happen when thresholds are breached

Deliverables

  • Problem Statement Document
  • Operational KPIs
  • Risk & Action Matrix

Favoriot Role

At this stage, Favoriot is not yet a platform.
It’s a thinking tool.

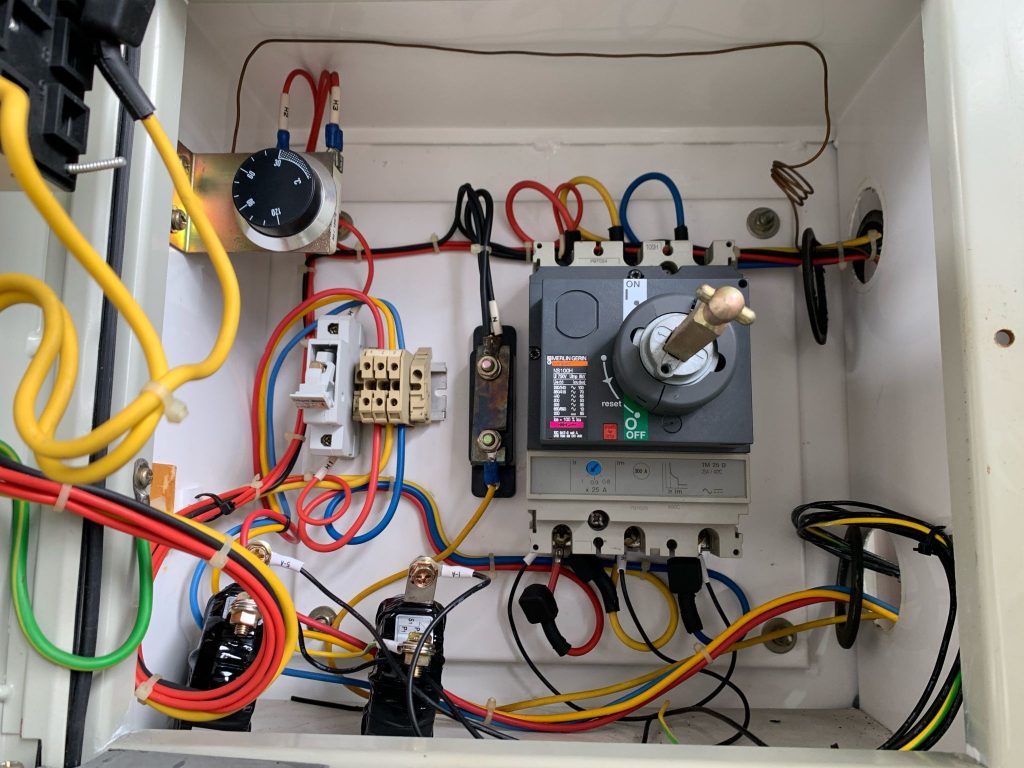
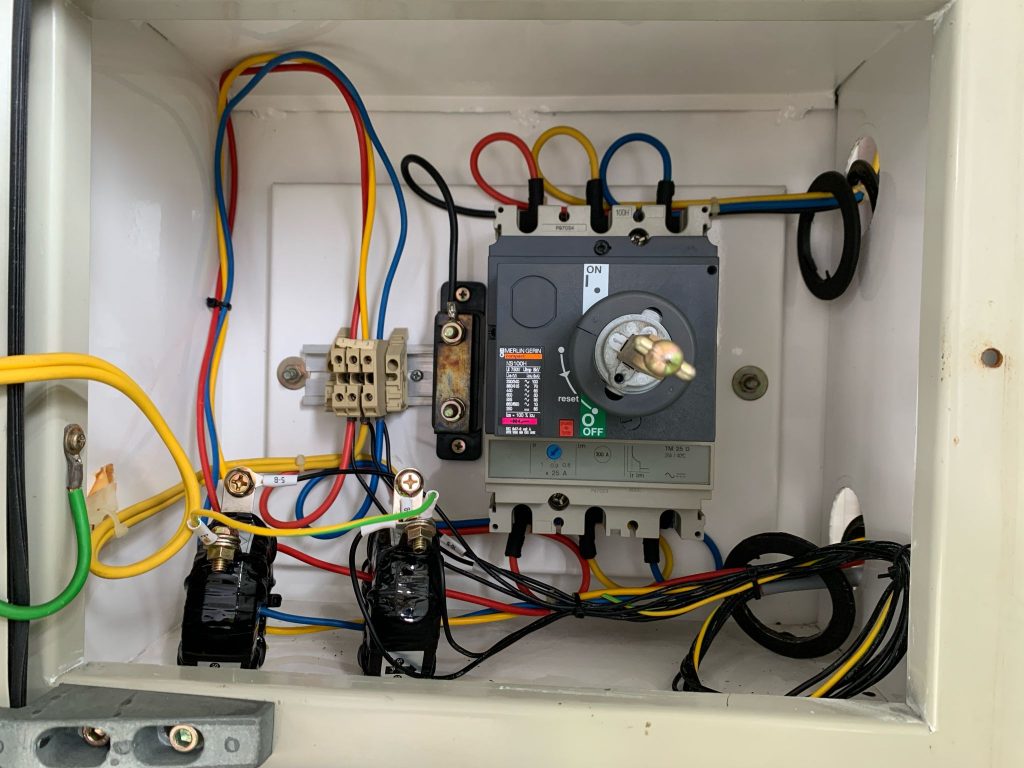
STEP 2: DATA FOUNDATION

Build a Reliable Data Pipeline

This is where many teams underestimate the effort.

I’ve seen projects fail here quietly.

What You Must Do

  • Select appropriate sensors and devices
  • Ensure stable connectivity (Wi-Fi, Cellular, LoRa, etc.).
  • Stream telemetry into Favoriot via APIs or Edge Gateway
  • Structure data into a time-series format
  • Ensure data consistency and uptime

Deliverables

  • Device Architecture Diagram
  • Data Schema Design
  • Connectivity Plan

Favoriot Role

  • Device integration
  • Data ingestion APIs
  • Secure cloud storage
  • Real-time data streaming

If this layer is weak, everything above it becomes unreliable.

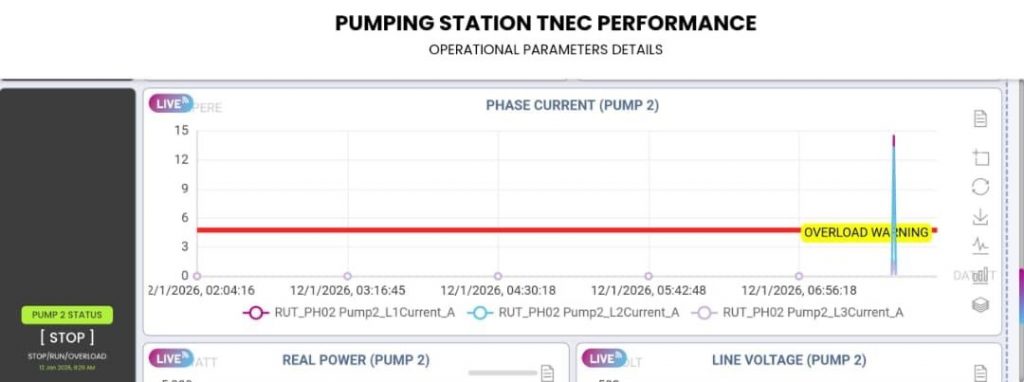
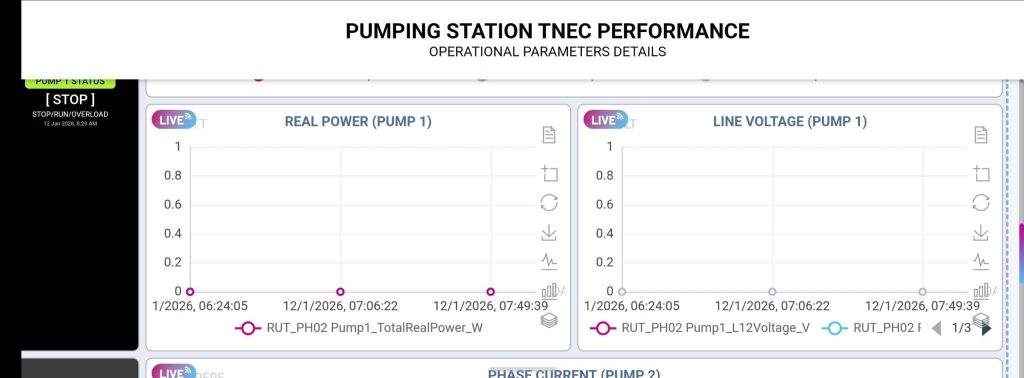
STEP 3: DESCRIPTIVE INSIGHTS

Make the Invisible Visible

This is usually the first “wow moment.”

Dashboards come alive. Data starts moving.

But I always remind teams:

“This is just the beginning.”

What You Must Do

  • Build dashboards for real-time monitoring
  • Track trends and historical performance
  • Define thresholds and basic alerts
  • Create operational visibility

Deliverables

  • Monitoring Dashboards
  • KPI Visualisation
  • Alert Configurations

Favoriot Role

  • Dashboard builder
  • Data visualisation
  • Rule-based alerts

Key Outcome

You now know what is happening.

But not yet why.

STEP 4: DIAGNOSTIC INSIGHTS

Move from Symptoms to Root Causes

This is where things get interesting.

I usually ask:

“Why did this happen… and can we prove it?”

What You Must Do

  • Correlate multiple data sources
  • Compare behaviour against baseline
  • Identify patterns across time and conditions
  • Detect anomalies early

Deliverables

  • Root Cause Analysis Reports
  • Correlation Models
  • Anomaly Detection Rules

Favoriot Role

  • Data exploration tools
  • Multi-sensor analysis
  • Pattern comparison

Key Outcome

You now understand why things happen.

STEP 5: PREDICTIVE INSIGHTS

Anticipate Before It Happens

This is the turning point.

From reacting… to preparing.

What You Must Do

  • Train models using historical data
  • Forecast trends and potential failures
  • Estimate risks and probabilities
  • Generate early warning signals

Deliverables

  • Prediction Models (ML/AI)
  • Forecast Reports
  • Risk Indicators

Favoriot Role

  • Integration with ML models
  • Data pipelines for training
  • Real-time prediction triggers

Key Outcome

You now know what is likely to happen next.

STEP 6: PRESCRIPTIVE INSIGHTS

Turn Insights into Action

This is where real business value appears.

I always tell teams:

“If nothing changes in your operations… your system is incomplete.”

What You Must Do

  • Define action rules and workflows
  • Trigger alerts with recommendations
  • Automate responses where possible
  • Keep humans in decision control

Deliverables

  • Decision Playbooks
  • Alert & Response Systems
  • Workflow Automation

Favoriot Role

  • Rule engine
  • Notification system (Telegram, email, etc.)
  • Integration with external systems

Key Outcome

You now know what to do… and when to do it.

PART 3: PUTTING IT ALL TOGETHER

Let me simplify this the way I usually do in my own head:

  • Step 1–2: Build meaning and trust
  • Step 3–4: Build understanding
  • Step 5–6: Enable action

Most projects stop too early.

That’s the problem.

PART 4: COMMON FAILURE POINTS (AND HOW TO AVOID THEM)

I’ve seen these patterns too many times.

1. Starting with Devices Instead of Problems

Fix: Always begin with Step 1

2. Poor Data Quality

Fix: Strengthen Step 2 before scaling

3. Dashboard Obsession

Fix: Move beyond Step 3 quickly

4. No AI Strategy

Fix: Plan for Step 5 early

5. No Action Layer

Fix: Define workflows in Step 6

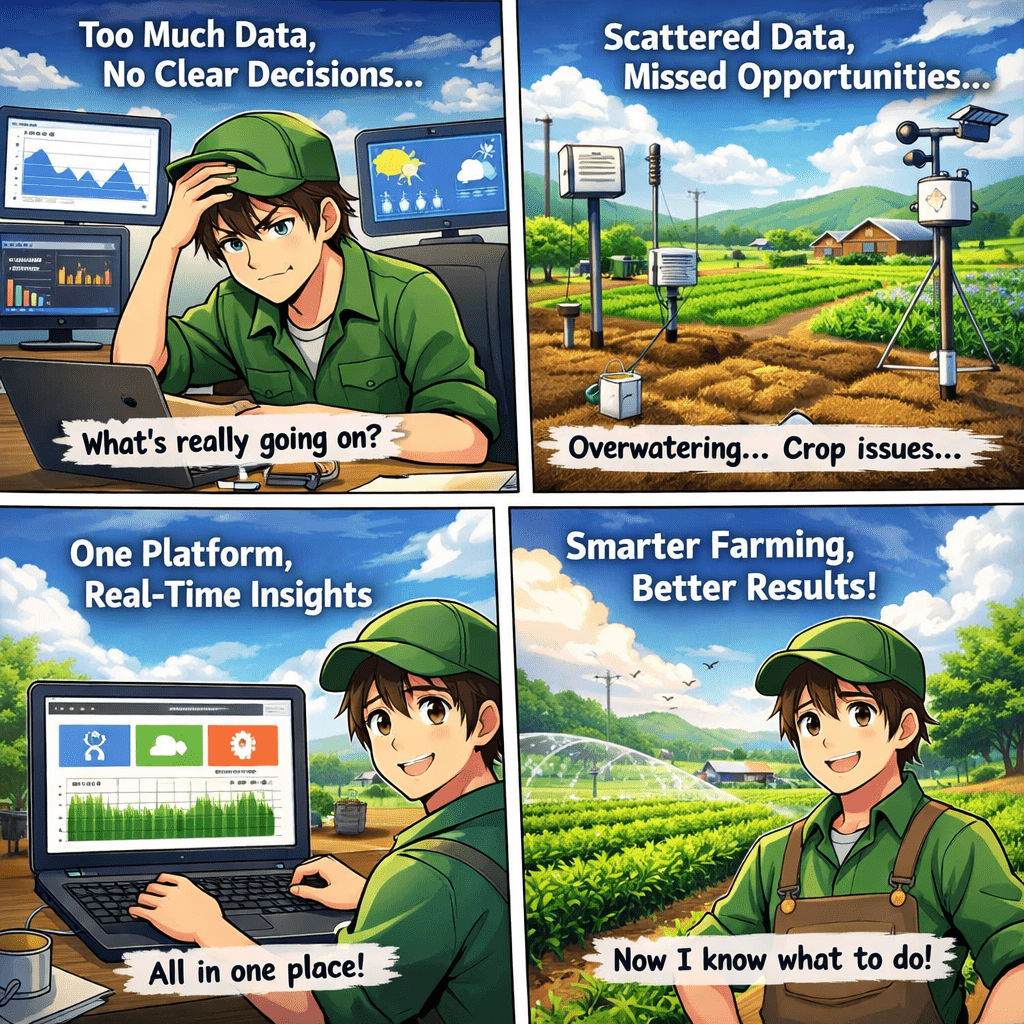
PART 5: SAMPLE USE CASE FLOW (AGRICULTURE)

Let’s make this real.

Scenario: Smart Farming

  • Step 1: Prevent crop loss due to poor irrigation
  • Step 2: Deploy soil moisture and temperature sensors
  • Step 3: Monitor farm conditions via dashboards
  • Step 4: Identify patterns between irrigation and yield
  • Step 5: Predict water needs based on weather trends
  • Step 6: Trigger irrigation recommendations automatically

Now the farmer is no longer guessing.

PART 6: WHO SHOULD USE THIS PLAYBOOK

This playbook is designed for:

  • Developers building AIoT solutions
  • System Integrators delivering projects
  • Enterprises deploying IoT at scale
  • Universities teaching IoT and AIoT
  • Government agencies implementing smart systems

FINAL REFLECTION

Sometimes I pause and ask myself:

Why do so many IoT projects fail to deliver real impact?

It’s not the technology.

It’s stopping too early.

This playbook exists to make sure you don’t.

Because in the end…

Data is not the goal.
Even insights are not the goal.

Action is.

How Macht Engineering Built an Airport IoT Monitoring System with Favoriot

How Macht Engineering Built an Airport IoT Monitoring System with Favoriot

April 6th, 2026 Posted by BLOG, HOW-TO, Internet of Things, IOT PLATFORM, PARTNER 0 thoughts on “How Macht Engineering Built an Airport IoT Monitoring System with Favoriot”

Airports don’t tolerate downtime.

Every system, every component, every utility must work quietly in the background. No noise. No failure. Just consistency. Because the moment something stops working, the impact is immediate.

One of the most overlooked yet critical systems in an airport is water management. Behind the scenes, water pump motors run continuously, supporting operations most passengers never even think about.

But what happens when these pumps fail?

That question led Macht Engineering to design a smarter way to monitor and protect these assets. Not through manual checks. Not through isolated systems. But through a connected, intelligent IoT solution powered by Favoriot.

This is the story of how a traditional monitoring setup evolved into a real-time, data-driven telemetry system.

How Macht Engineering Built an Airport IoT Monitoring System with Favoriot

The Problem No One Notices Until It Fails

Water pump motors are not glamorous assets.

They don’t appear in dashboards shown to executives. They don’t attract attention during innovation showcases. But when they stop working, everything else feels the impact.

In many facilities, monitoring is still done manually or through localised control systems. Technicians check readings. Data is recorded periodically. Faults are often detected only after something goes wrong.

“Are we really seeing what’s happening in real time… or just reacting after the damage is done?”

That question became the turning point.

Macht Engineering recognised that the real issue was not the lack of data. It was the lack of visibility and timely action.

Rethinking Monitoring: From Reactive to Proactive

Instead of waiting for failures, the goal shifted toward early detection and continuous monitoring.

The objectives were clear:

  • Monitor motor performance in real time
  • Detect abnormal electrical behaviour before failure occurs
  • Enable faster maintenance response
  • Protect high-value equipment
  • Ensure uninterrupted operations

But achieving this required more than just sensors. It required a system that could connect, analyse, and present data in a way that teams could act on immediately.

That’s where IoT came in.

Building the System: Industrial Strength Meets Cloud Intelligence

Macht Engineering designed a solution that blends reliable industrial hardware with cloud-based intelligence.

At the heart of the system is the Mitsubishi PLC FX5U, a robust controller widely used in industrial environments. It acts as the brain, collecting data from sensors and executing control logic.

To measure the electrical health of the pump motors, Current Transformers (CTs) were installed. These sensors continuously monitor current flow, providing critical insights into load conditions and potential anomalies.

“If you can see the current patterns, you can almost predict the future behaviour of the motor.”

Connectivity is handled by the Teltonika RUT200 Industrial Router, ensuring stable and secure communication between the on-site system and the cloud. In environments like airports, reliability is not optional. It is mandatory.

To safeguard the system, protection components such as Surge Protection Devices (SPD), MCBs, and fuses were integrated. These ensure that electrical disturbances do not damage the system or compromise operations.

All components are structured neatly using terminal blocks and utility sockets, making maintenance and troubleshooting easier.

But hardware alone does not solve the problem.

Where Data Becomes Insight: The Role of Favoriot

This is where the system moves from being “connected” to being “intelligent.”

Favoriot acts as the central platform that transforms raw data into something meaningful.

Data collected by the PLC is transmitted to the cloud, where Favoriot processes and visualises it in real time. Maintenance teams can now see exactly what is happening on the ground without being physically present.

Instead of static readings, they get dynamic trends.

Instead of guesswork, they get clarity.

Real-Time Visibility

Operators can monitor current load patterns in real time. Any unusual spikes or drops become immediately visible.

Alerts That Matter

Thresholds can be set so that when conditions go beyond acceptable limits, alerts are triggered instantly. No waiting. No delays.

Historical Analysis

Over time, data builds a story. Patterns emerge. Trends become clear. Teams can identify early signs of wear or inefficiency.

“This is not just monitoring. This is understanding behaviour.”

Remote Access

Engineers no longer need to be on-site to know what’s happening. The system can be accessed from anywhere, enabling faster decision-making.

Scalability

The same architecture can be extended to monitor additional assets across the airport. One system. Multiple use cases.

The Shift That Changes Everything

Before this system, monitoring was reactive.

Something fails. Then action is taken.

After implementing the IoT solution, the approach becomes proactive.

Something starts to behave abnormally. Action is taken before failure happens.

This shift may sound simple, but its impact is significant.

Measurable Impact on Operations

The deployment of this system has led to several tangible outcomes:

Continuous Operational Visibility

Maintenance teams now have a live view of motor performance at all times. No blind spots.

Reduced Downtime

Early detection means issues are addressed before they escalate into failures.

Better Asset Protection

Electrical faults can be identified early, reducing the risk of damage to expensive equipment.

Improved Maintenance Efficiency

Teams spend less time on routine checks and more time on meaningful interventions.

Data-Driven Decisions

Decisions are no longer based on assumptions. They are backed by real data.

“We are no longer guessing. We are acting based on evidence.”

Why This Matters Beyond One Airport

This project is not just about water pumps.

It represents a broader shift in how organisations manage critical infrastructure.

Many industries still operate with limited visibility into their assets. Data exists, but it is fragmented, delayed, or underutilised.

IoT changes that.

But more importantly, platforms like Favoriot ensure that the data is not just collected, but actually used.

Because in the end, value does not come from data.

It comes from decisions.

A Blueprint for Intelligent Infrastructure

The collaboration between Macht Engineering and Favoriot offers a practical blueprint:

  1. Start with a clear operational problem
  2. Capture the right data using reliable hardware
  3. Ensure secure and stable connectivity
  4. Use a platform that turns data into actionable insights
  5. Focus on outcomes, not just dashboards

“Are we building systems that look good… or systems that actually make a difference?”

That question is worth asking in every IoT project.

Moving Forward

As airports and other critical facilities continue to modernise, the demand for intelligent monitoring systems will only grow.

What Macht Engineering has implemented is not just a solution for today. It is a foundation for future expansion, including predictive analytics and AI-driven maintenance.

And it all starts with visibility.

If you are still relying on manual monitoring or disconnected systems, it may be time to rethink your approach.

Because the difference between reacting and predicting can determine the reliability of your entire operation.

If you are exploring how to implement similar IoT solutions in your organisation, reach out to Favoriot to learn how you can turn your operational data into real-time, actionable intelligence.

[Photo Credit to Mach Engineering]

When IoT Data Is Everywhere… But Decisions Are Nowhere

April 3rd, 2026 Posted by BLOG, Internet of Things, IOT PLATFORM, PRODUCT 0 thoughts on “When IoT Data Is Everywhere… But Decisions Are Nowhere”

Many organisations today are collecting more data than ever.

Sensors. Devices. Dashboards. Real-time streams.

But here’s the uncomfortable truth.

Having data doesn’t always mean making better decisions.

I remember sitting with a team that had already invested in IoT. Everything was connected.

Yet one of them said:

“We have all this data… but we still don’t know what’s really going on.”

That’s the real problem.

The Hidden Challenge with IoT Data

Most teams don’t struggle to collect IoT data anymore.

They struggle to use it.

Data is:

  • scattered across multiple platforms
  • stored in different formats
  • viewed in separate dashboards

Each system shows something.
But no system shows everything.

So decisions become slower. Less confident. Sometimes reactive.

What Organisations Actually Need

Let’s keep it simple.

Teams don’t need more dashboards.

They need:

  • a clear view of operations
  • real-time insights they can trust
  • the ability to act quickly

In short, they need data that leads to action.

A Real Smart Agriculture Example

Take a typical smart farming setup.

A farm installs:

  • soil moisture sensors
  • weather monitoring systems
  • automated irrigation

Data is collected continuously.

But in reality?

The farm manager still checks:

  • One system for soil conditions
  • another for weather forecasts
  • another for irrigation controls

Nothing is connected.

So irrigation decisions are still based on estimation.

The result:

  • Overwatering in some areas
  • delayed watering in others
  • inconsistent crop quality
  • unnecessary water usage

Not due to lack of data.

But due to a lack of clarity.

From Data Collection to Data-Driven Farming

Now imagine a different scenario.

All IoT data is brought into one platform.

The farm manager sees:

  • real-time soil moisture levels
  • upcoming weather conditions
  • irrigation readiness

All in one place.

No switching systems. No guesswork.

Just clear, actionable insight.

This is what data-driven agriculture should feel like.

How Favoriot Helps

Favoriot helps organisations turn scattered IoT data into decisions they can actually act on.

In agriculture, that means:

Connect everything
Sensors, weather data, and irrigation systems in one platform.

Visualise what matters
Simple dashboards focused on key conditions.

Act in real time
Trigger irrigation based on actual needs, not assumptions.

Turn data into action with Favoriot

The Impact of Real-Time IoT Insights

When data starts working together, things change quickly.

Farms begin to:

  • reduce water usage
  • improve crop consistency
  • respond faster to changing conditions

And perhaps most importantly…

Decisions become easier.

What Happens Without It

If IoT data remains disconnected:

  • Inefficiencies continue quietly
  • Resources are wasted daily
  • opportunities for optimisation are missed

No dramatic failure.

Just small losses… repeated over time.

Start Turning IoT Data Into Action

Collecting data is no longer the challenge.

Making it useful is.

If your organisation is already investing in IoT, the next step is clear:

Start turning your data into action today.

Because when your data finally makes sense…

Better decisions follow naturally.

Contact us at info@favoriot.com to schedule an appointment.

Copyright © 2026 All rights reserved