Students using Favoriot Platform

Students of IoT – This is For You

May 8th, 2026 Posted by BLOG, HOW-TO, Internet of Things, IOT PLATFORM, PRODUCT, Training 0 thoughts on “Students of IoT – This is For You”
Finally, Your IoT Project Works | Favoriot
Your IoT journey starts here

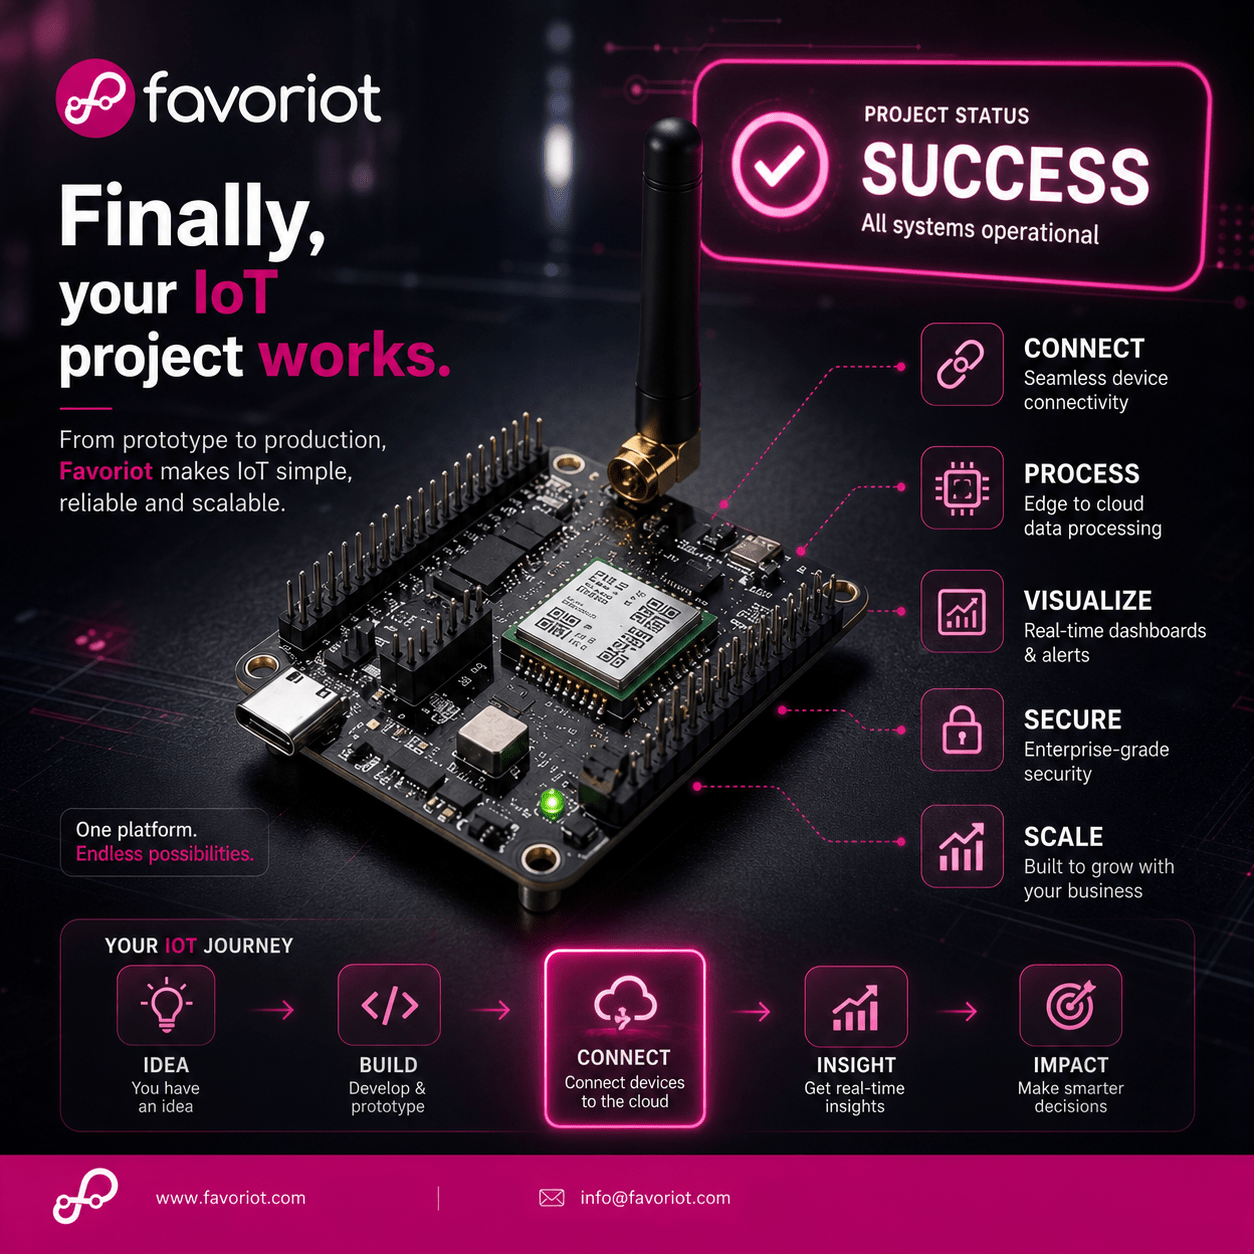
Finally, your IoT project works.

From prototype to production, Favoriot helps you connect devices, send data to the cloud, monitor in real time, and turn sensor readings into smarter decisions.

Devices connected without unnecessary complexity
Data stored in the cloud and ready to monitor
Real-time insights, dashboards, and alerts
The real problem

Many IoT projects get stuck between demo and deployment.

The idea is good. The device may even work. But the project slows down when teams need to connect, store, visualise, secure, and scale the system.

Devices connect today, fail tomorrow

Without a clear platform path, teams waste time fixing repeated connectivity and data transmission issues.

Data exists but nobody acts

Sensor readings alone are not enough. Teams need dashboards, alerts, and context to make the data useful.

Prototypes struggle to grow

A single device may work in the lab, but real deployment needs structure, user access, security, and future growth.

The path forward

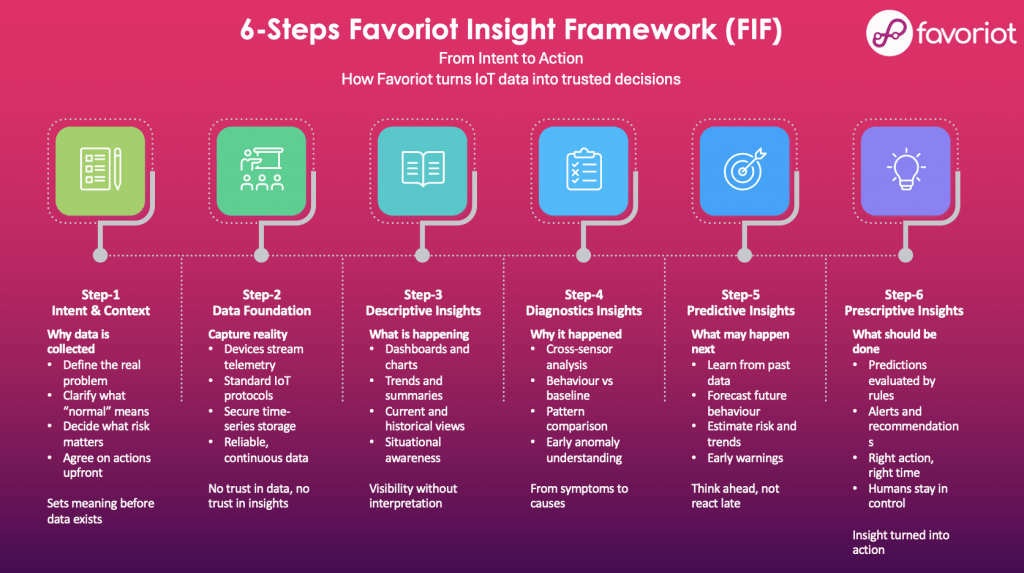
Build your IoT project through a clearer journey.

Favoriot gives you a practical platform to move from idea to impact, one step at a time.

1

Idea

Start with a real problem you want to monitor, measure, or improve.

2

Build

Develop your prototype using sensors, devices, and simple project logic.

3

Connect

Send device data to the Favoriot cloud and monitor it from anywhere.

4

Insight

View dashboards, understand patterns, and receive alerts when something changes.

5

Impact

Make smarter decisions and turn your prototype into a system people can use.

What Favoriot helps you do

One platform for connecting, processing, visualising, securing, and scaling IoT.

Whether you are building a student project, teaching IoT, testing a proof of concept, or deploying a business solution, the platform gives structure to the journey.

🔗

Connect

Connect devices to the cloud and reduce the friction of moving from hardware to real-time data.

Process

Manage incoming IoT data so it becomes easier to understand, store, and prepare for action.

📊

Visualize

Create dashboards and alerts that help users know what is happening now and what needs attention.

🔒

Secure and Scale

Move beyond a one-time demo with a platform approach that supports wider deployment and growth.

Built for different builders

Favoriot helps the people who turn ideas into working IoT systems.

Students

Build stronger final year projects with real device-to-cloud experience.

Lecturers

Teach IoT using practical labs, shared dashboards, and real project flow.

Developers

Prototype faster and focus on the solution instead of building everything from scratch.

Organisations

Monitor assets, improve response time, and turn field data into operational decisions.

One platform. Many use cases.

Monitor. Automate. Improve. All with Favoriot.

Favoriot can support IoT projects across multiple sectors where visibility, alerts, and real-time data matter.

🏙Smart Cities
🌱Agriculture
🏭Manufacturing
Energy
Healthcare
📦Logistics
The choice

What failure and success look like

The difference is not whether you have sensors. The difference is whether your project produces useful action.

Failure looks like this

  • The project works only during the demo.
  • Data is collected but nobody knows what it means.
  • The dashboard is opened once and forgotten.
  • The device cannot scale beyond one prototype.
  • The team spends more time fixing tools than solving the real problem.

Success looks like this

  • Devices stay connected and data flows to the cloud.
  • Users can see what is happening in real time.
  • Alerts help teams respond before problems grow.
  • Students, lecturers, developers, and companies build with confidence.
  • Your IoT project moves from prototype to real impact.

Start your IoT journey with Favoriot.

Register the Favoriot platform today and turn your idea into a connected, visible, and action-ready IoT project.

Register Favoriot Platform
www.favoriot.com
info@favoriot.com

© Favoriot. From prototype to production, your IoT journey starts here.

Why Open IoT Platforms Are Gaining Ground Over Closed, Hardware-Locked Systems

Why Open IoT Platforms Like Favoriot Outperform Closed, Hardware-Locked Systems

April 19th, 2026 Posted by BLOG 0 thoughts on “Why Open IoT Platforms Like Favoriot Outperform Closed, Hardware-Locked Systems”

Many proprietary IoT platforms are designed to operate exclusively with their own hardware ecosystem. While this approach may appear convenient during initial deployment, it introduces structural limitations that become increasingly significant as organisations scale.

An open, hardware-agnostic platform such as Favoriot addresses these limitations directly. Below is a critical comparison outlining why open platforms consistently deliver stronger long-term value.

1. Avoidance of Vendor Lock-In

Closed IoT platforms create dependency across multiple layers:

  • Device procurement
  • Communication protocols
  • Platform features and roadmap

Once deployed, switching costs can increase by 3–5x due to system redesign, hardware replacement, and integration rework.

Favoriot eliminates this constraint by supporting a wide range of devices and protocols, including microcontrollers (ESP32), industrial PLCs, and LPWAN technologies (LoRa, NB-IoT).

Implication:
Organisations retain strategic control over technology decisions instead of being constrained by a single vendor.

2. Lower Total Cost of Ownership (TCO)

Hardware-locked platforms often embed margin into:

  • Proprietary sensors and gateways (typically 20–40% higher than market alternatives)
  • Mandatory device replacements
  • Limited sourcing flexibility

Over a deployment of 1,000 devices, even a RM100 premium per device results in an additional RM100,000 in upfront cost alone.

Favoriot allows:

  • Competitive hardware sourcing
  • Incremental upgrades without full replacement
  • Cost optimisation across the lifecycle

Implication:
More predictable and controllable cost structure over time.

3. Scalability Across Multiple Use Cases

Closed platforms are typically designed for narrow, vertical applications (e.g., smart buildings, asset tracking). Extending beyond the original use case often requires:

  • Additional platforms
  • Parallel systems
  • Complex integrations

Favoriot is built as a horizontal platform capable of supporting:

  • Smart cities
  • Agriculture
  • Industrial monitoring
  • Energy management

All within a unified architecture.

Implication:
A single platform investment can support multiple business domains, reducing duplication and complexity.

4. Interoperability and Integration Capability

Proprietary platforms frequently restrict interoperability to maintain ecosystem control. This leads to:

  • Limited API access
  • Data silos
  • High integration effort with enterprise systems

Favoriot provides:

  • Open REST APIs
  • Flexible data ingestion pipelines
  • Compatibility with external systems such as ERP, analytics engines, and AI models

Implication:
Data can be operationalised across the organisation rather than remaining isolated within the platform.

5. Faster Time-to-Market

In closed environments, feature development and device compatibility are dependent on vendor priorities. This often results in:

  • Delays in deployment
  • Reduced responsiveness to business needs

Favoriot enables:

  • Rapid prototyping using widely available hardware
  • Immediate integration without waiting for vendor support
  • Faster deployment cycles (often reduced by 30–50%)

Implication:
Organisations can capture value earlier and respond quickly to operational requirements.

6. Focus on Business Outcomes Rather Than Infrastructure Constraints

Closed platforms often require teams to spend significant effort on:

  • Device compatibility issues
  • System limitations
  • Workarounds for missing features

Favoriot abstracts much of the infrastructure complexity by providing:

  • Data ingestion and management
  • Visualisation tools
  • Built-in analytics capabilities

Implication:
Teams can focus on high-value outcomes such as reducing downtime, improving efficiency, and enhancing customer experience.

7. Reduced Risk of Technical Debt

Closed platforms may offer simplicity at the early stages, but over time:

  • Customisation becomes constrained
  • Scaling introduces architectural limitations
  • Migration costs increase significantly

Favoriot’s flexible architecture supports gradual expansion without requiring system replacement.

Implication:
Lower long-term technical debt and reduced risk of costly replatforming.

8. Data Ownership and Accessibility

In many proprietary systems, data access is limited or controlled by the vendor, resulting in:

  • Restricted export capabilities
  • Limited transparency
  • Challenges in advanced analytics adoption

Favoriot ensures:

  • Full access to raw and processed data
  • Easy integration with third-party analytics and AI tools
  • Clear data ownership

Implication:
Data becomes a usable asset for decision-making rather than a locked resource.

9. Reduced Business Risk

Relying on a single vendor introduces operational risk:

  • Pricing changes
  • Product discontinuation
  • Vendor instability

Favoriot’s hardware-agnostic approach ensures that:

  • Devices can be replaced or upgraded independently
  • The platform remains usable regardless of hardware vendor changes

Implication:
Greater resilience and continuity for long-term deployments.

10. Shift from Device-Centric to Decision-Centric Architecture

Most proprietary platforms are built around device management and connectivity.

However, the real value of IoT lies in:

  • Detecting anomalies early
  • Triggering actions
  • Supporting operational decisions

Favoriot is structured to move beyond data collection toward:

  • Real-time situational awareness
  • Actionable insights
  • Decision support

Implication:
The platform directly contributes to measurable outcomes such as cost reduction, efficiency gains, and risk mitigation.

Conclusion

Closed, hardware-dependent IoT platforms may offer short-term convenience, but they introduce long-term constraints in cost, scalability, and flexibility.

Open platforms like Favoriot provide:

  • Greater control
  • Lower lifecycle costs
  • Faster deployment
  • Stronger alignment with business outcomes

In practical terms, organisations are not choosing between two types of platforms.

They are choosing between:

  • A controlled ecosystem with built-in limitations
  • Or a flexible foundation that can grow with their ambitions

Schedule an appointment with Favoriot to help you in your IoT journey.

Favoriot Insight Framework

FAVORIOT AIoT PLAYBOOK

April 8th, 2026 Posted by BLOG, Favoriot Insight Framework, HOW-TO, Internet of Things, IOT PLATFORM, NEWS 0 thoughts on “FAVORIOT AIoT PLAYBOOK”

Building Real-World AIoT Solutions Using the Favoriot Insight Framework (FIF)

I’ve seen many teams start their IoT journey with energy… and then slowly lose momentum.

Not because they lack technology.
But because they lack structure.

So I asked myself one day:

What if we gave them a clear path… from idea to action?

That’s how this playbook is meant to be used.

PART 1: HOW TO USE THIS PLAYBOOK

Before we jump into the steps, let’s get one thing clear.

This is not a theory document.

This is a working guide for:

  • Favoriot training programs
  • AIoT solution design workshops
  • Real project deployments
  • Consultancy engagements

You can use this playbook in two ways:

1. As a Starting Guide

If you are new to AIoT, follow Steps 1-6 in sequence.

2. As a Diagnostic Tool

If you already have a system, use this to identify gaps:

  • Stuck at dashboards? You’re at Step 3
  • No predictive capability? You haven’t reached Step 5
  • No automation? You’re missing Step 6

PART 2: THE 6-STEP FIF EXECUTION MODEL

Let me walk you through this the same way I would in a real workshop.

STEP 1: INTENT & CONTEXT

Define the Problem Before Touching Technology

I always pause here and ask:

“If we don’t collect a single data point… what decision are we trying to make?”

What You Must Do

  • Define the real problem, not the symptoms
  • Identify key risks (downtime, safety, cost, compliance)
  • Establish what “normal” looks like
  • Agree on what actions should happen when thresholds are breached

Deliverables

  • Problem Statement Document
  • Operational KPIs
  • Risk & Action Matrix

Favoriot Role

At this stage, Favoriot is not yet a platform.
It’s a thinking tool.

STEP 2: DATA FOUNDATION

Build a Reliable Data Pipeline

This is where many teams underestimate the effort.

I’ve seen projects fail here quietly.

What You Must Do

  • Select appropriate sensors and devices
  • Ensure stable connectivity (Wi-Fi, Cellular, LoRa, etc.).
  • Stream telemetry into Favoriot via APIs or Edge Gateway
  • Structure data into a time-series format
  • Ensure data consistency and uptime

Deliverables

  • Device Architecture Diagram
  • Data Schema Design
  • Connectivity Plan

Favoriot Role

  • Device integration
  • Data ingestion APIs
  • Secure cloud storage
  • Real-time data streaming

If this layer is weak, everything above it becomes unreliable.

STEP 3: DESCRIPTIVE INSIGHTS

Make the Invisible Visible

This is usually the first “wow moment.”

Dashboards come alive. Data starts moving.

But I always remind teams:

“This is just the beginning.”

What You Must Do

  • Build dashboards for real-time monitoring
  • Track trends and historical performance
  • Define thresholds and basic alerts
  • Create operational visibility

Deliverables

  • Monitoring Dashboards
  • KPI Visualisation
  • Alert Configurations

Favoriot Role

  • Dashboard builder
  • Data visualisation
  • Rule-based alerts

Key Outcome

You now know what is happening.

But not yet why.

STEP 4: DIAGNOSTIC INSIGHTS

Move from Symptoms to Root Causes

This is where things get interesting.

I usually ask:

“Why did this happen… and can we prove it?”

What You Must Do

  • Correlate multiple data sources
  • Compare behaviour against baseline
  • Identify patterns across time and conditions
  • Detect anomalies early

Deliverables

  • Root Cause Analysis Reports
  • Correlation Models
  • Anomaly Detection Rules

Favoriot Role

  • Data exploration tools
  • Multi-sensor analysis
  • Pattern comparison

Key Outcome

You now understand why things happen.

STEP 5: PREDICTIVE INSIGHTS

Anticipate Before It Happens

This is the turning point.

From reacting… to preparing.

What You Must Do

  • Train models using historical data
  • Forecast trends and potential failures
  • Estimate risks and probabilities
  • Generate early warning signals

Deliverables

  • Prediction Models (ML/AI)
  • Forecast Reports
  • Risk Indicators

Favoriot Role

  • Integration with ML models
  • Data pipelines for training
  • Real-time prediction triggers

Key Outcome

You now know what is likely to happen next.

STEP 6: PRESCRIPTIVE INSIGHTS

Turn Insights into Action

This is where real business value appears.

I always tell teams:

“If nothing changes in your operations… your system is incomplete.”

What You Must Do

  • Define action rules and workflows
  • Trigger alerts with recommendations
  • Automate responses where possible
  • Keep humans in decision control

Deliverables

  • Decision Playbooks
  • Alert & Response Systems
  • Workflow Automation

Favoriot Role

  • Rule engine
  • Notification system (Telegram, email, etc.)
  • Integration with external systems

Key Outcome

You now know what to do… and when to do it.

PART 3: PUTTING IT ALL TOGETHER

Let me simplify this the way I usually do in my own head:

  • Step 1–2: Build meaning and trust
  • Step 3–4: Build understanding
  • Step 5–6: Enable action

Most projects stop too early.

That’s the problem.

PART 4: COMMON FAILURE POINTS (AND HOW TO AVOID THEM)

I’ve seen these patterns too many times.

1. Starting with Devices Instead of Problems

Fix: Always begin with Step 1

2. Poor Data Quality

Fix: Strengthen Step 2 before scaling

3. Dashboard Obsession

Fix: Move beyond Step 3 quickly

4. No AI Strategy

Fix: Plan for Step 5 early

5. No Action Layer

Fix: Define workflows in Step 6

PART 5: SAMPLE USE CASE FLOW (AGRICULTURE)

Let’s make this real.

Scenario: Smart Farming

  • Step 1: Prevent crop loss due to poor irrigation
  • Step 2: Deploy soil moisture and temperature sensors
  • Step 3: Monitor farm conditions via dashboards
  • Step 4: Identify patterns between irrigation and yield
  • Step 5: Predict water needs based on weather trends
  • Step 6: Trigger irrigation recommendations automatically

Now the farmer is no longer guessing.

PART 6: WHO SHOULD USE THIS PLAYBOOK

This playbook is designed for:

  • Developers building AIoT solutions
  • System Integrators delivering projects
  • Enterprises deploying IoT at scale
  • Universities teaching IoT and AIoT
  • Government agencies implementing smart systems

FINAL REFLECTION

Sometimes I pause and ask myself:

Why do so many IoT projects fail to deliver real impact?

It’s not the technology.

It’s stopping too early.

This playbook exists to make sure you don’t.

Because in the end…

Data is not the goal.
Even insights are not the goal.

Action is.

Copyright © 2026 All rights reserved