

Why IoT Pilots Don’t Scale — And What You Can Do About It

May 29th, 2026 Posted by BLOG, HOW-TO, Internet of Things, IOT PLATFORM, PARTNER 0 thoughts on “Why IoT Pilots Don’t Scale — And What You Can Do About It”
Why IoT Pilots Don’t Scale — And What You Can Do About It | Favoriot Blog
Favoriot / Blog / Why IoT Pilots Don’t Scale
IoT Strategy

Why IoT Pilots Don’t Scale — And What You Can Do About It

Your sensors are working. Your dashboard is live. The demo went well. So why is the project still stuck at the same stage it was six months ago?

You have sensors sending data. You have a dashboard. And yet, when something goes wrong, people still ask — what actually happened? Here is how to close that gap in three steps.

You are not alone in this. It is the most common IoT story. The pilot worked. Everyone was impressed. Then the project quietly stalled — and now nobody can explain why.

Before you blame the technology, stop. The technology is rarely the problem. The way the pilot was designed is the problem. And the good news is — that is something you can fix.

The Pilot Was Designed to Impress, Not to Scale

Think about how most IoT pilots are run. You pick the best location. The cleanest use case. The most cooperative team. You run it for 90 days, generate a report, and declare success.

But a pilot that is built to impress is almost never built to scale.

The moment you try to replicate it — across ten buildings, fifty machines, or five departments — the gaps appear. The connectivity assumptions break. The integration that worked for one vendor’s device fails for another. The dashboard that one team used does not match how the next team works.

The uncomfortable truth

If your pilot did not ask “how would this work at full scale?” from day one, it was not really a pilot. It was a performance. And performances do not become operations.

Six Reasons Your IoT Pilot Is Still Stuck

  • 1

    Your data stops at the dashboard

    Sensors collect. Data flows. A chart appears. And then nothing. You have not defined what action should happen next. The dashboard is not the destination — it is just the beginning. If your pilot ends at the dashboard, it has not finished the job.

  • 2

    Nobody in the business owns the outcome

    Your IoT pilot lives in IT. But the results it is supposed to deliver belong to operations, facilities, or finance. When nobody in the business unit is accountable for the outcome, the project becomes an orphan after the initial excitement fades.

  • 3

    Your platform was built for one scenario

    Custom-built solutions work well for a single context. Try to extend them — new device types, new departments, new protocols — and the cost explodes. If you built everything from scratch for the pilot, you will have to build everything again for the next use case.

  • 4

    You measured the wrong things

    Uptime. Sensors connected. Data volume. These look technical and credible. But they do not tell you whether you made a better decision because of the data. Measuring the wrong things creates the illusion of success while the real problem stays unsolved.

  • 5

    Your team never learned how the system works

    The vendor set everything up. The vendor ran the pilot. Now the vendor has moved on. And your internal team is managing a system they never fully understood. Dependency without capability is not a deployment — it is ongoing helplessness.

  • 6

    Scaling was assumed, not planned

    Your pilot budget covered sensors and a dashboard. Nobody budgeted for integration, change management, training, platform licences at scale, or ongoing maintenance. Scaling was assumed to happen automatically. It never does.

IoT did not fail your organisation. The plan failed. And the plan failed because nobody designed it for the real world.

Here Is the Three-Step Path Forward

Scaling an IoT project is not about doing the same thing more times. It is a fundamentally different challenge. And it follows a clear path — one that most pilots skip halfway through.

Step 1 — Connect

Bring your devices into one place

Connect your sensors, machines, and systems into a single platform — regardless of vendor or protocol. You cannot see what you cannot reach. And you cannot scale what you cannot connect. The foundation must support multiple device types without requiring you to rebuild for every new scenario.

Step 2 — See

Turn data into something you can actually use

Build dashboards and analytics that show you what matters — not just what is happening. The right view for the right team. Real-time visibility into the assets and environments that affect your operations. This is where scattered data starts to become useful information.

Step 3 — Act

Let your data trigger a response

Set up alerts, automations, and AIoT intelligence that converts insight into action. This is the step most pilots never reach. And it is the only step that delivers real operational value. If your system cannot respond to what it sees, you have not finished building it.

Connect → See → Act. That is the full journey. A pilot that stops at Connect has only proven that sensors can send data. A deployment that reaches Act has proven that IoT works.

The Platform Question You Need to Ask Before Your Next Pilot

One of the most overlooked reasons pilots fail to scale is the platform itself.

If your IoT deployment is built on a single vendor’s proprietary stack, you do not fully own your project. You are renting access to it. And when you try to extend it — new devices, new use cases, new teams — the cost and complexity grow faster than the value.

Ask this before the pilot starts: “If we need to add a new device type or a new department in 12 months, what does that actually cost — in time, money, and effort?” The answer will tell you whether you are building something that can grow or something that will need to be replaced.

Four Questions to Ask Before You Approve Your Next Pilot Budget

Use these before the pilot — not after it stalls.

01
What specific decision will improve because of this data? If the answer is vague, the pilot will be vague.
02
Who in the business — not IT — is accountable for the outcome? If the answer is nobody, the outcome will be nobody’s problem.
03
Can the platform support ten times more devices without rebuilding? If the answer is no, you are planning for a demo, not a deployment.
04
What does full-scale deployment cost — and is that budget realistic? If nobody has asked this yet, ask it now.

A Pilot Should Surface Problems, Not Hide Them

The purpose of a pilot is to learn — not to impress. A good pilot deliberately surfaces the hard questions. Integration challenges. Organisational resistance. Data quality gaps. Alert fatigue. User adoption issues.

It brings those problems to the surface before they are expensive to fix.

A bad pilot hides those problems in the name of a smooth demo. And when the project tries to scale, every hidden problem becomes a visible barrier.

The organisations that successfully scale IoT are not the ones with the most impressive pilots. They are the ones who used their pilots to ask hard questions — and built the answers into their plan before committing serious budget.


Your IoT project does not have to become another cautionary story about pilots that never grew into deployments. But avoiding that outcome starts with one decision: design for scale from day one, not as an afterthought.

The path is clear. Connect your data. See what is really happening. Act on what you find.

That is how you move from a pilot that impressed everyone — to a deployment that helps everyone.

Ready to move from pilot to deployment?

Favoriot helps you connect your devices, see your operations in real time, and act on data — without building everything from scratch.

Explore Favoriot Book a Strategy Call
IoT Strategy AIoT Pilot Projects Scaling IoT Connect See Act Favoriot Digital Transformation
Smart Behaviour Analytics for Shopping Mall

Smart Behaviour Analytics for Shopping Mall

May 29th, 2026 Posted by BLOG 0 thoughts on “Smart Behaviour Analytics for Shopping Mall”
Smart Behaviour Analytics for Shopping Mall | Favoriot Insight Framework
Project Challenge #6 · Favoriot Insight Framework

Smart Behaviour Analytics for Shopping Malls

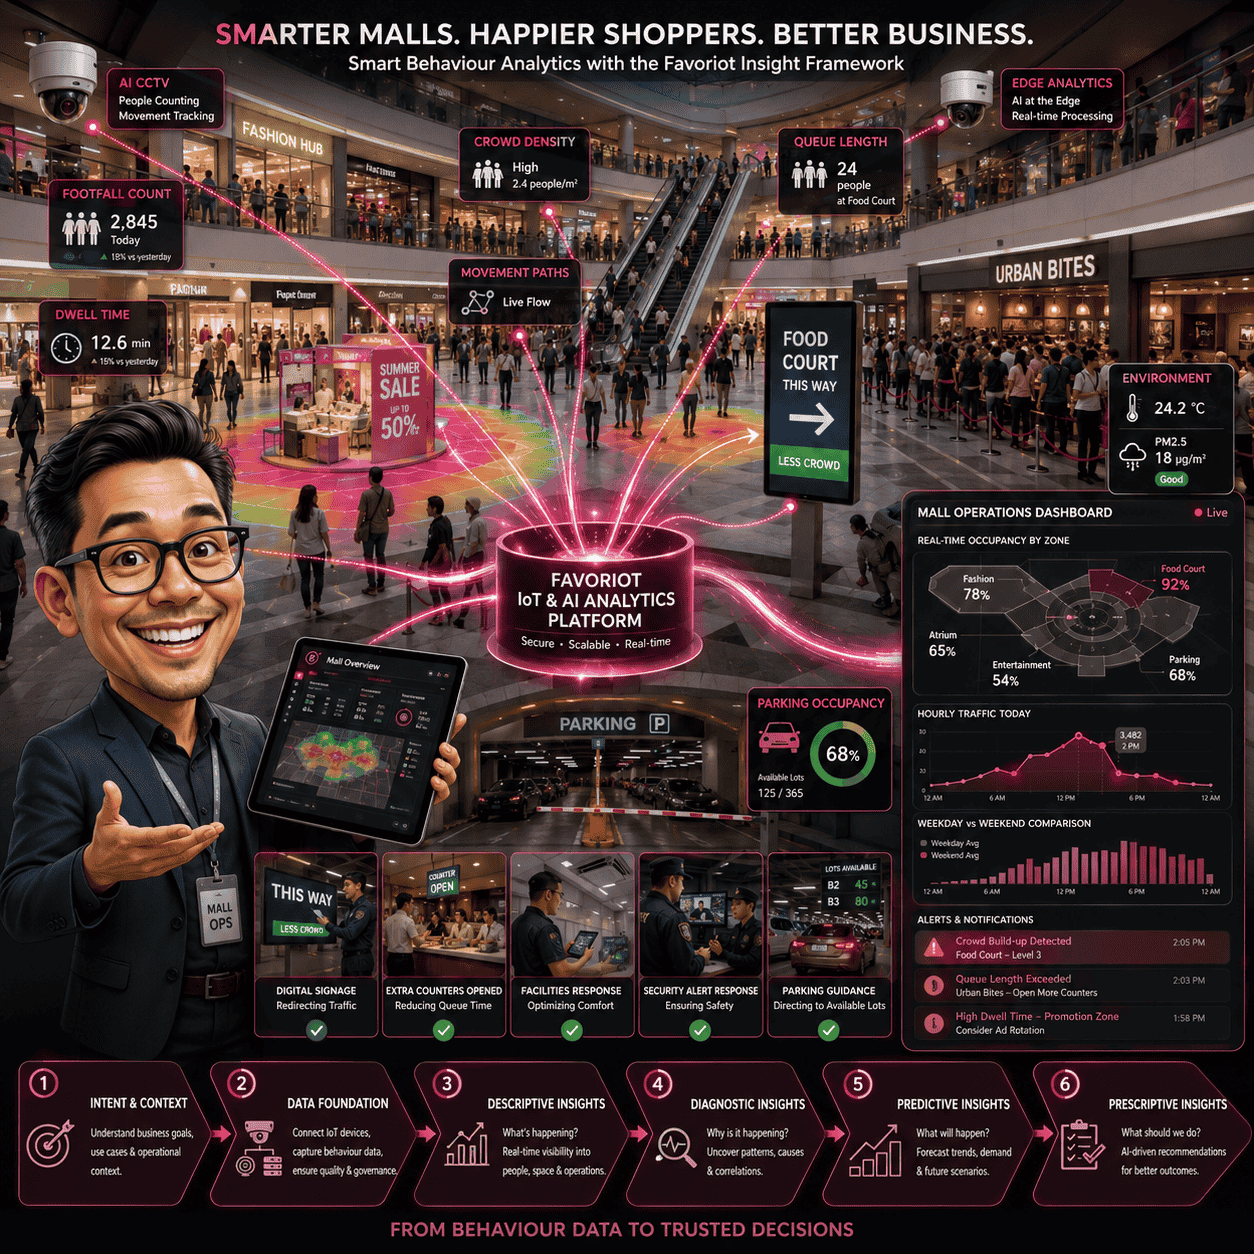
Shopping malls are full of signals. Visitors move, pause, queue, gather, and respond to promotions. The real challenge is turning those signals into trusted decisions that improve experience, safety, tenant performance, and operations.

From Visitor Movement to Mall Intelligence

Video analytics, IoT data, dashboards, AI insights, alerts, and guided action in one structured flow.

Real-time Footfall visibility
Predictive Crowd risk alerts
Actionable Tenant reports
Privacy-first Behaviour metadata

The hidden problem inside many shopping malls

Every day, thousands of visitors create useful operational signals. Yet many mall decisions are still made using fragmented reports, assumptions, or delayed observations.

Invisible visitor behaviour

Mall operators may see the crowd, but they often cannot measure movement paths, dwell time, queue length, or density patterns in real time.

Slow response to congestion

Without early warning, overcrowding is usually handled after the problem is already visible to shoppers, tenants, and security teams.

Weak tenant and campaign insight

Leasing, promotions, and tenant placement become harder to justify when decisions are not backed by measurable behaviour data.

“Each movement carries intent. Each pattern reflects preference. Each crowd formation signals opportunity or risk.”

The Favoriot Insight Framework for Smart Behaviour Analytics

The original article describes the framework from Layer 0 to Layer 5. In this webpage, it has been renumbered from Layer 1 to Layer 6 while keeping the same flow: intent, data, visibility, diagnosis, prediction, and action.

1

Layer 1: Intent and Context

  • Improve customer experience through smoother traffic flow.
  • Increase tenant revenue by balancing footfall distribution.
  • Enhance safety through real-time crowd density monitoring.
  • Support leasing, marketing, and ESG reporting with reliable data.
2

Layer 2: Data Foundation

  • AI-enabled CCTV cameras with edge-based video analytics.
  • People counting and zone tracking modules.
  • Parking occupancy sensors.
  • Environmental sensors for temperature and air quality.
  • Secure data transmission to the Favoriot Platform.
3

Layer 3: Descriptive Insights

  • Real-time occupancy levels by zone.
  • Hourly and daily foot traffic trends.
  • Heat maps showing high engagement areas.
  • Historical views of visitor patterns.
4

Layer 4: Diagnostic Insights

  • Identify why queue formations happen.
  • Correlate promotions with footfall spikes.
  • Compare underperforming zones against normal behaviour.
  • Detect unexpected crowd build-up early.
5

Layer 5: Predictive Insights

  • Forecast peak hours using historical data.
  • Estimate crowd density risks during public holidays or events.
  • Predict tenant performance trends.
  • Prepare teams before congestion becomes a public issue.
6

Layer 6: Prescriptive Insights

  • Trigger alerts when density thresholds are exceeded.
  • Recommend opening more counters during queue build-up.
  • Suggest traffic redirection through digital signage.
  • Align energy usage with actual occupancy levels.
“Without trusted data, trusted insights cannot exist.”

Business impact for shopping mall operators

Smart Behaviour Analytics helps shopping malls move from passive observation into measurable action.

Customer Experience

  • Reduced waiting time.
  • Balanced crowd movement.
  • Comfortable and safer shopping environment.

Tenant Performance

  • Data-backed store placement decisions.
  • Measurable campaign performance.
  • Stronger lease discussions using analytics.

Operations

  • Better staffing allocation.
  • Smarter security deployment.
  • Management reporting based on real activity.

Sustainability and ESG

  • Occupancy-linked energy planning.
  • Reduced unnecessary lighting and HVAC operation.
  • Clearer environmental performance reporting.

Governance and privacy must come first

Behaviour analytics should help operators understand patterns, not invade personal identity.

Privacy-first design principle

The solution can focus on anonymised metadata such as footfall count, dwell time, movement direction, queue length, and crowd density. This allows mall operators to gain operational intelligence without storing identifiable personal information.

“The ability to sense, interpret, predict, and act on human behaviour defines the next generation of retail competitiveness.”

Ready to turn shopping mall behaviour into trusted decisions?

Favoriot helps organisations move beyond scattered dashboards by connecting devices, data, analytics, rules, alerts, and decision workflows into one practical IoT intelligence layer.

Schedule an Appointment with Favoriot
© 2026 Favoriot · Smart Behaviour Analytics for Shopping Mall · From Data to Decisions
How Energy Data Becomes Trusted Decisions

How Energy Data Becomes Trusted Decisions Using Favoriot

May 28th, 2026 Posted by BLOG, Favoriot Insight Framework, HOW-TO, Internet of Things, IOT PLATFORM 0 thoughts on “How Energy Data Becomes Trusted Decisions Using Favoriot”
Smart Energy Management Using the Favoriot Insight Framework
Project Challenge #5 · Smart Energy Management

How Energy Data Becomes Trusted Decisions

Smart Energy Management is not only about meters, dashboards, and monthly bills. It begins with clear intent, trusted data, meaningful insights, and timely action.

From Intent to Action

Smart buildings need more than energy visibility

Many organisations can see energy consumption, but fewer can explain why waste happens, what risks are coming, and which actions should be taken next.

Designed with purpose before technology

Smart Energy Management must start by asking a simple question: why is energy data being collected?

The Favoriot Insight Framework helps organisations move from raw telemetry to practical decisions for cost control, asset care, ESG reporting, and operational governance.

The result is a building that is not merely monitored, but understood.

Smart Energy Management must be designed with intent before technology.

The right question comes before the right sensor.

Favoriot Insight Framework

The 6-layer path from energy data to action

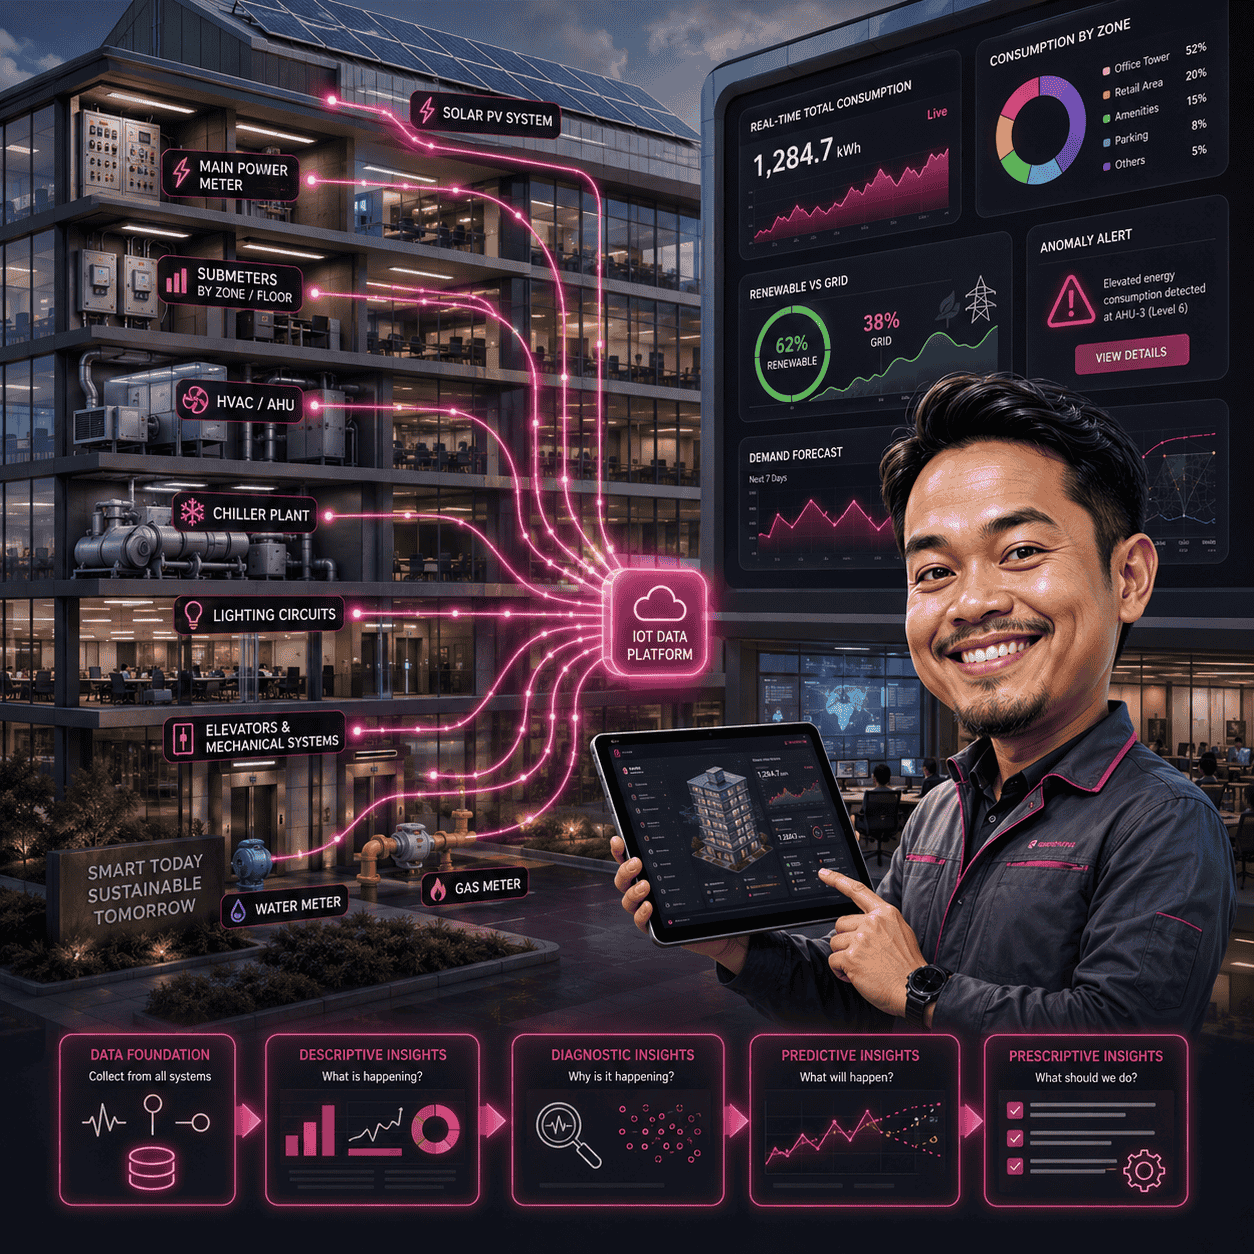
The original article used Layer 0 to Layer 5. This webpage renumbers them as Layer 1 to Layer 6.

1

Intent and Context

Why is energy data being collected?
  • Define the real energy management problem.
  • Set what normal consumption means for the building.
  • Identify risks such as peak demand penalties, carbon exposure, or equipment failure.
  • Decide what actions should happen when anomalies appear.
2

Data Foundation

Capture reality.
  • Collect data from main meters and submeters.
  • Monitor HVAC, chillers, lighting, elevators, and mechanical systems.
  • Include solar generation, water, and gas readings where needed.
  • Send trusted telemetry into Favoriot’s time series storage.
3

Descriptive Insights

What is happening?
  • View real-time total consumption.
  • Track historical energy patterns.
  • Compare load by zone, floor, or tenant.
  • Measure energy intensity per square meter.
4

Diagnostic Insights

Why did it happen?
  • Compare current behaviour against baselines.
  • Link temperature, occupancy, and power usage.
  • Detect causes behind nighttime spikes or weekend usage.
  • Move from symptoms to causes.
5

Predictive Insights

What may happen next?
  • Forecast future energy demand.
  • Estimate peak load risks.
  • Identify seasonal trends.
  • Generate early warnings for high-load conditions.
6

Prescriptive Insights

What should be done?
  • Trigger alerts based on configurable rules.
  • Recommend corrective actions.
  • Support load shifting during peak tariff periods.
  • Escalate ESG deviations to management.

From passive infrastructure to measurable energy intelligence

With the Favoriot Insight Framework, buildings can move beyond reactive troubleshooting. Energy data becomes structured evidence for better decisions, stronger accountability, and clearer sustainability reporting.

Why it matters

Energy management affects cost, reliability, ESG, and governance

When energy behaviour becomes measurable, teams can act earlier and manage buildings with greater confidence.

💰

Financial Discipline

Energy costs are a controllable operational expense. Structured monitoring helps reduce waste and manage peak demand.

⚙️

Operational Reliability

Energy anomalies can signal equipment stress. Early detection protects assets and reduces sudden failures.

🌱

ESG and Sustainability

Time-stamped energy data supports carbon reporting, emissions tracking, and green building evidence.

📊

Governance

Energy performance becomes measurable, comparable, and reviewable across teams and buildings.

“Without trusted data, trusted insights cannot exist.”

“The building begins to think ahead rather than react late.”

“At this stage, insight is turned into action.”

Key Use Cases

Practical areas where Smart Energy Management delivers value

Each use case can move naturally across the six layers of the Favoriot Insight Framework.

1 Peak Demand Improvement
2 HVAC Performance Monitoring
3 Renewable Energy Performance Tracking
4 Tenant-Based Submeter Billing
5 Carbon Emission Conversion and Reporting
6 Executive Sustainability Dashboard

Ready to turn your building’s energy data into trusted decisions?

Favoriot can help your organisation strengthen cost control, sustainability performance, ESG credibility, and operational accountability through Smart Energy Management.

© 2026 Favoriot · Smart Energy Management · From Data to Decisions

Copyright © 2026 All rights reserved